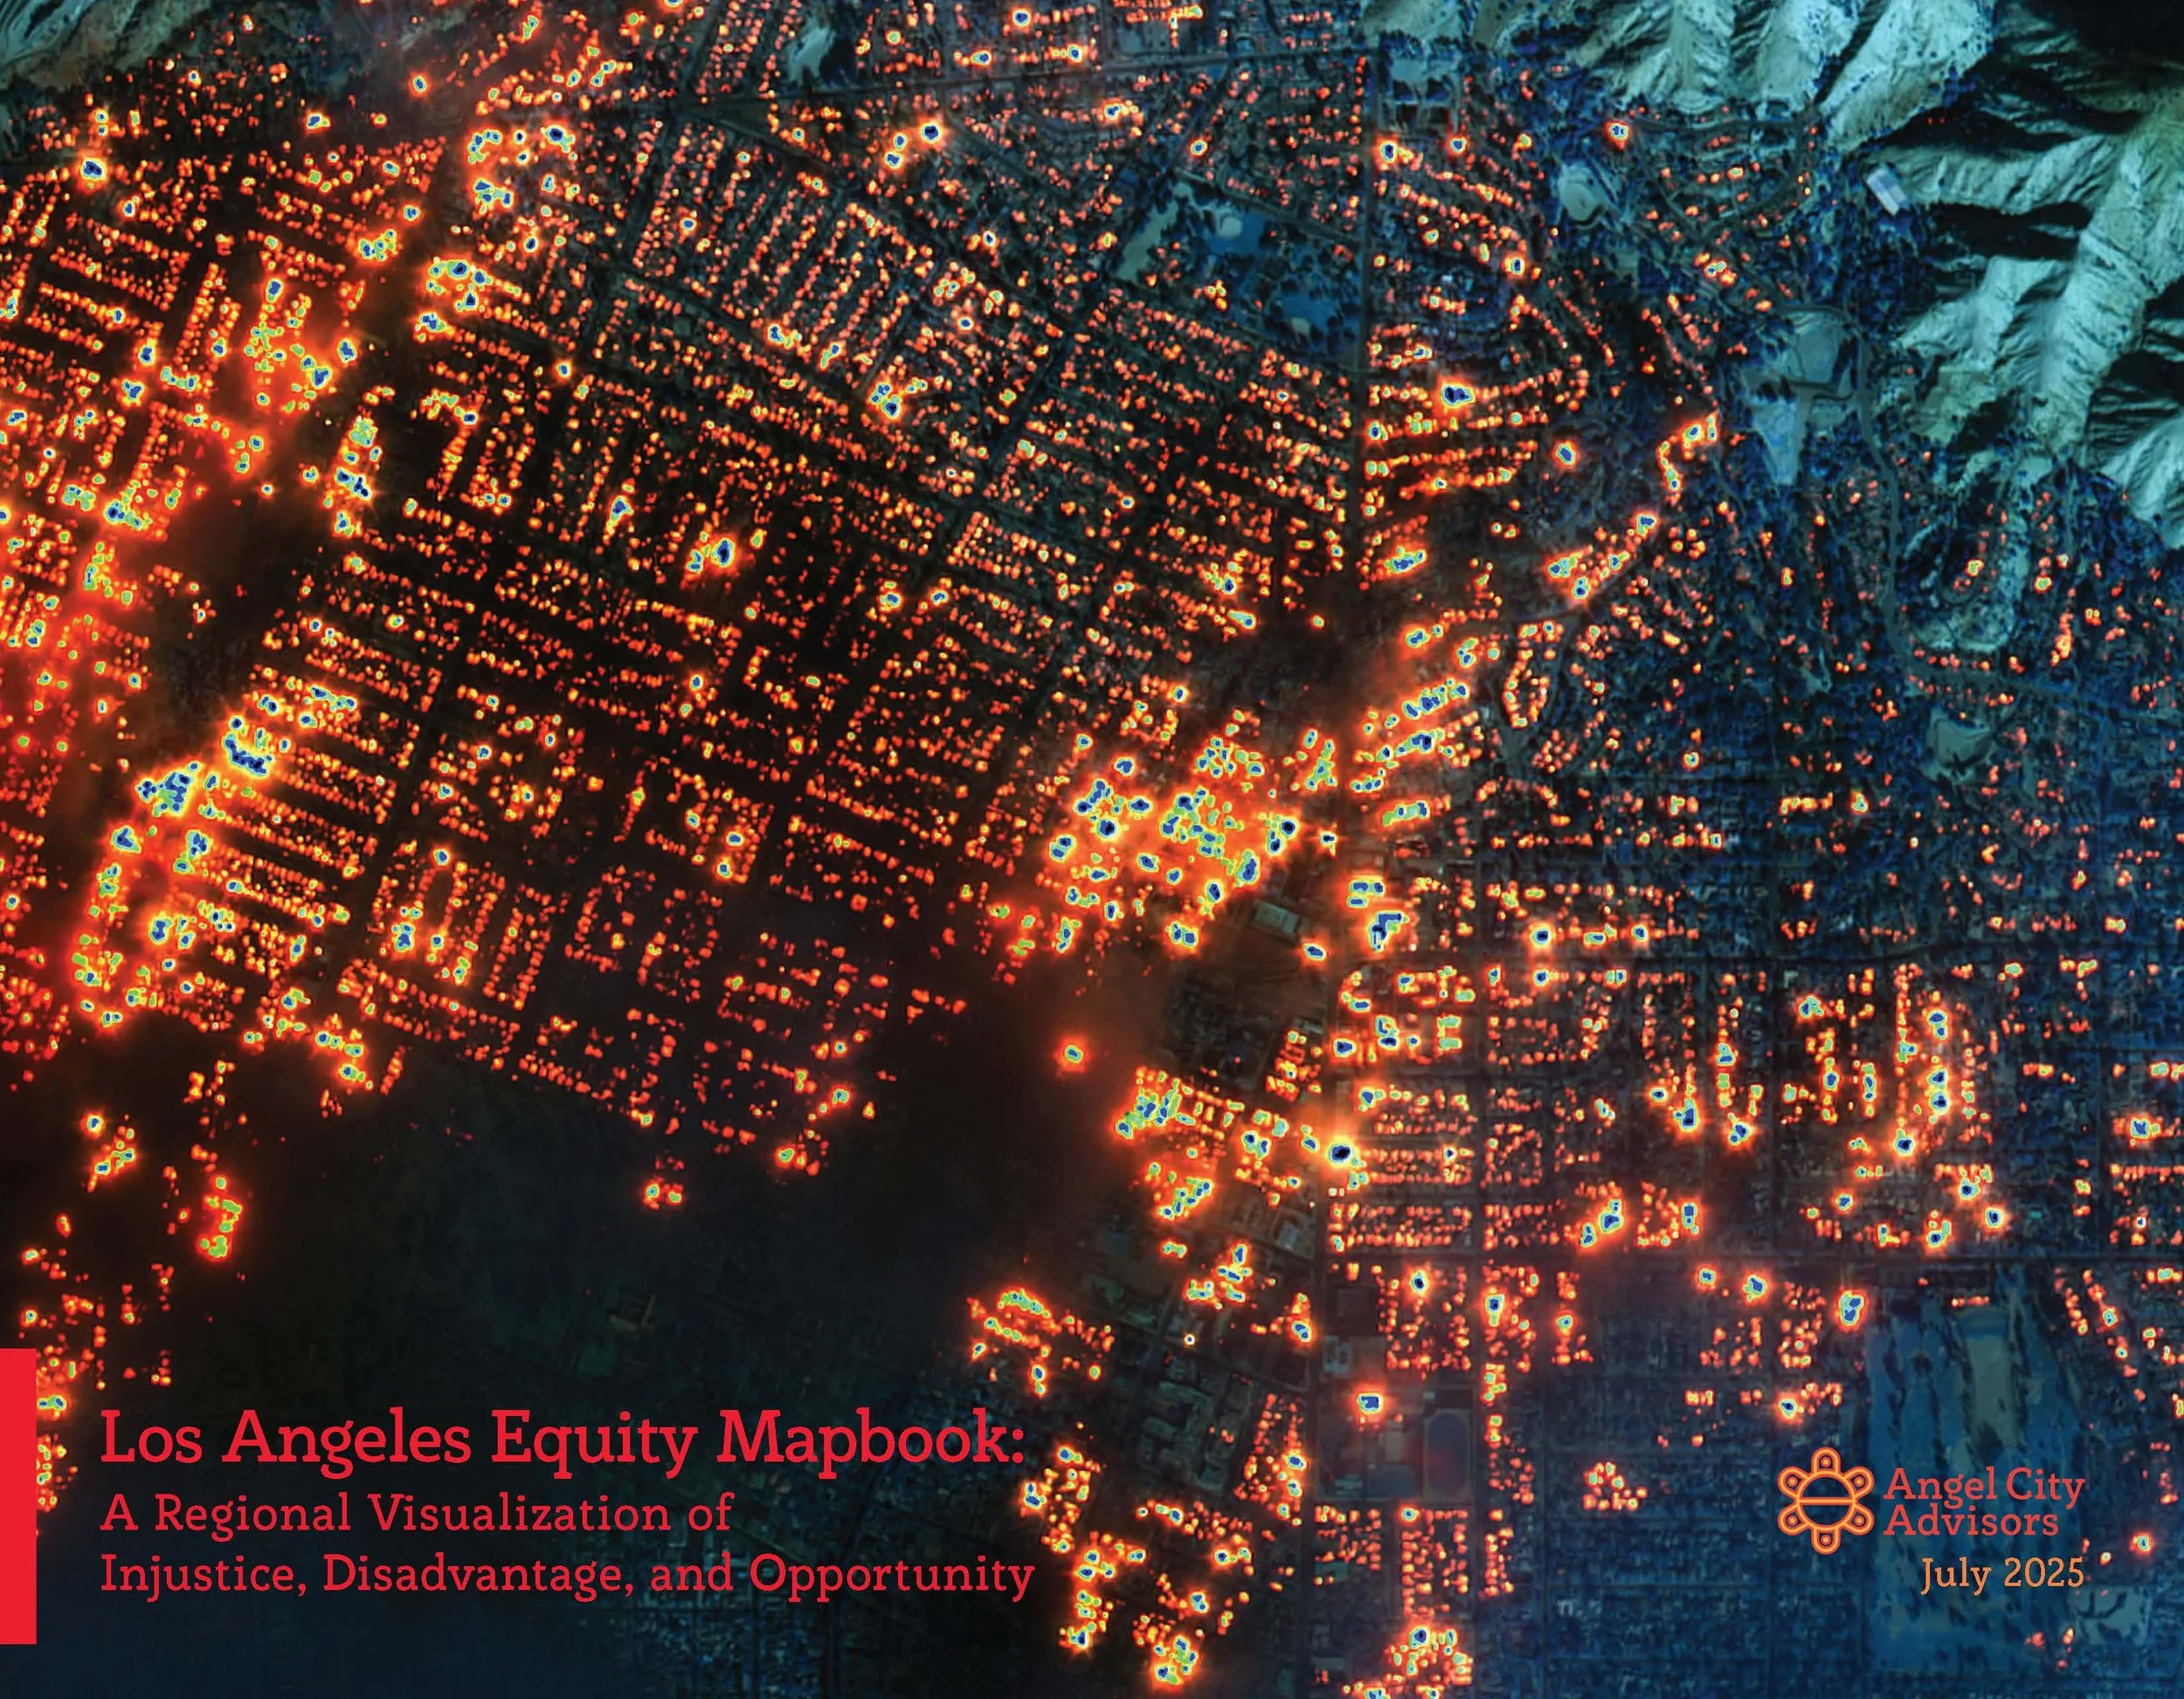
Los Angeles Equity Mapbook
We all must continue to fight injustice where we see it, and where we don’t.
For community benefit, Angel City is proud to offer the 2025 Los Angeles Equity Mapbook. The product is a collection of 46 maps that visualize injustice and exclusion (and opportunity) across the Los Angeles County region. Since the national civil unrest of 2020, we have been collecting various County-wide data sets – some public, others not – and mapping them across our region. These maps are for you to use, cite, and ACT upon. We were proud to release our first Equity Mapbook in 2020 at a time of racial reckoning in America, and are pleased to have now released our first update with additional maps and an updated underlying data set.
Mapbook Highlights & Context
Racial, economic, and environmental injustice is deeply embedded in America. However, we note that structural inequity is predominantly a man-made problem. That means it can be unmade by intention and no-excuses action by investors, policymakers, and funders guided by good data. Angel City Advisors acknowledges that we operate in a unique chapter in history and we endorse the need for systemic change that holds up a genuine multiracial democracy as its north star. We believe that bold intervention is required in the arenas of civil rights (such as criminal justice reform, expanded voting rights, and immigrants’ rights) as well as economic parity (such as wealth creation, education access, and housing access) and environmental resilience (limiting pollution and carbon emissions and protecting vulnerable communities from unfair impacts).
Our small Los Angeles firm helps connect capital and expertise to community voices, using data and our professional experience to design and execute investment strategy. So when we ask ourselves what resources, knowledge, and power we wield to confront structural racism and regional inequity, this capacity is our expertise. We offer this data without reservation to all changemakers.
We have also constructed a Social Equity Index that blends 14 of these variables into a single metric that was mapped across the Los Angeles region. In a more nuanced way, it shows which Los Angeles communities are unfairly impacted across multiple structural and current socioeconomic disadvantages. It also weights co-location with place-based investment opportunities. The Equity Index product was first submitted to the Los Angeles County CEO’s Office as part of ongoing economic development and resiliency efforts. With their partnership, it is now an open resource to everyone.
Our hope is that community activists, policymakers, funders, investors, researchers, and others will avail themselves of this information in making decisions about social policy, community investments, and resource allocations. Social change requires sustained, intentional effort - and clear, accurate information. Please use this data for good.
These data visualizations can be freely printed and downloaded individually or as an entire mapbook. The Social Equity Index can be printed as a wall map. We hope it is a new tool that can educate those with power, empower change agents, and help mitigate the racist policies and conditions that have been perpetuated in Los Angeles since its founding. Should you wish to promote the maps in your networks or continue the conversations, we are using the following social media hashtags:
#laequitymaps #angelcityadv
High Resolution Content for Download
Click on each map photo to open a high resolution PDF map available to print, download, and use.
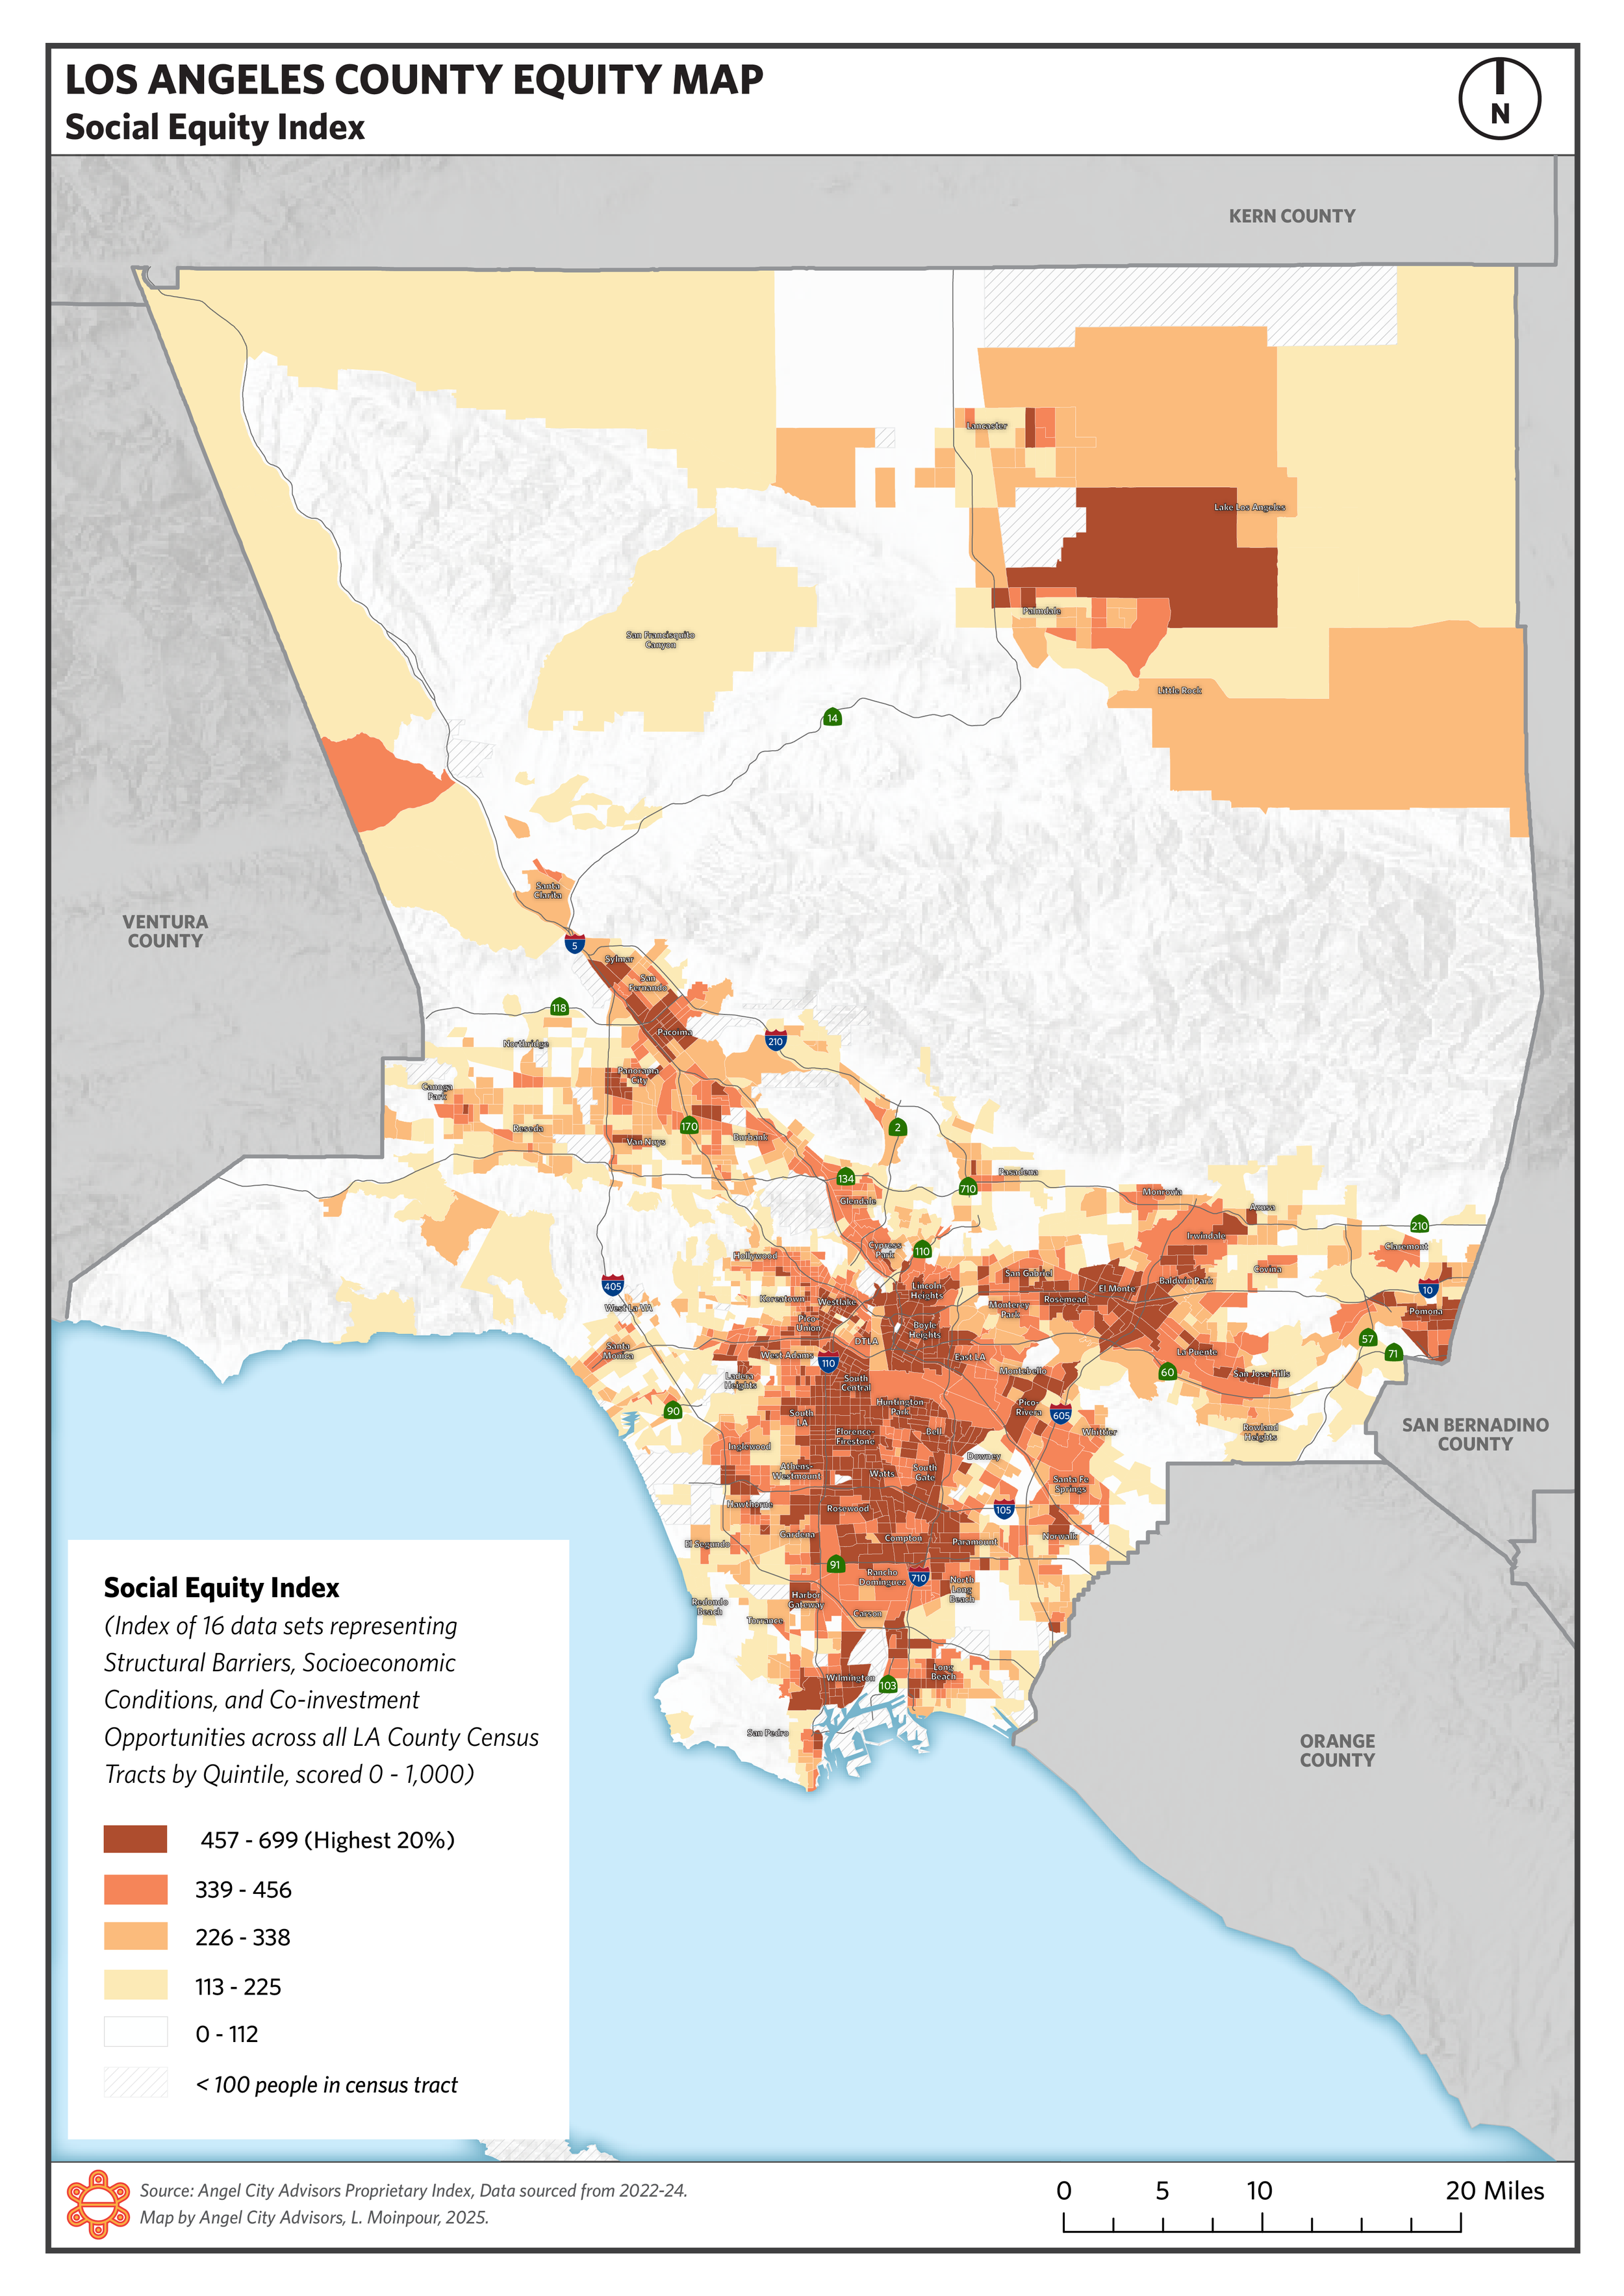
Social Equity Index: Poster Size PDF

Social Equity Index: Letter Size PDF
Los Angeles Equity Mapbook (all maps at smaller size)
Wildfire Maps
This is a new addition to the 2025 collection using data to visualize the January 2025 Los Angeles wildfires. We offer Countywide maps as well as zoom-ins on the most impacted areas.

Wildfire Hazard Severity Zones and 2025 Fire Perimeters

Wildfire Risk Areas

Wildfire Risk and Disadvantaged Communities

2025 Eaton Wildfire Structural Damage
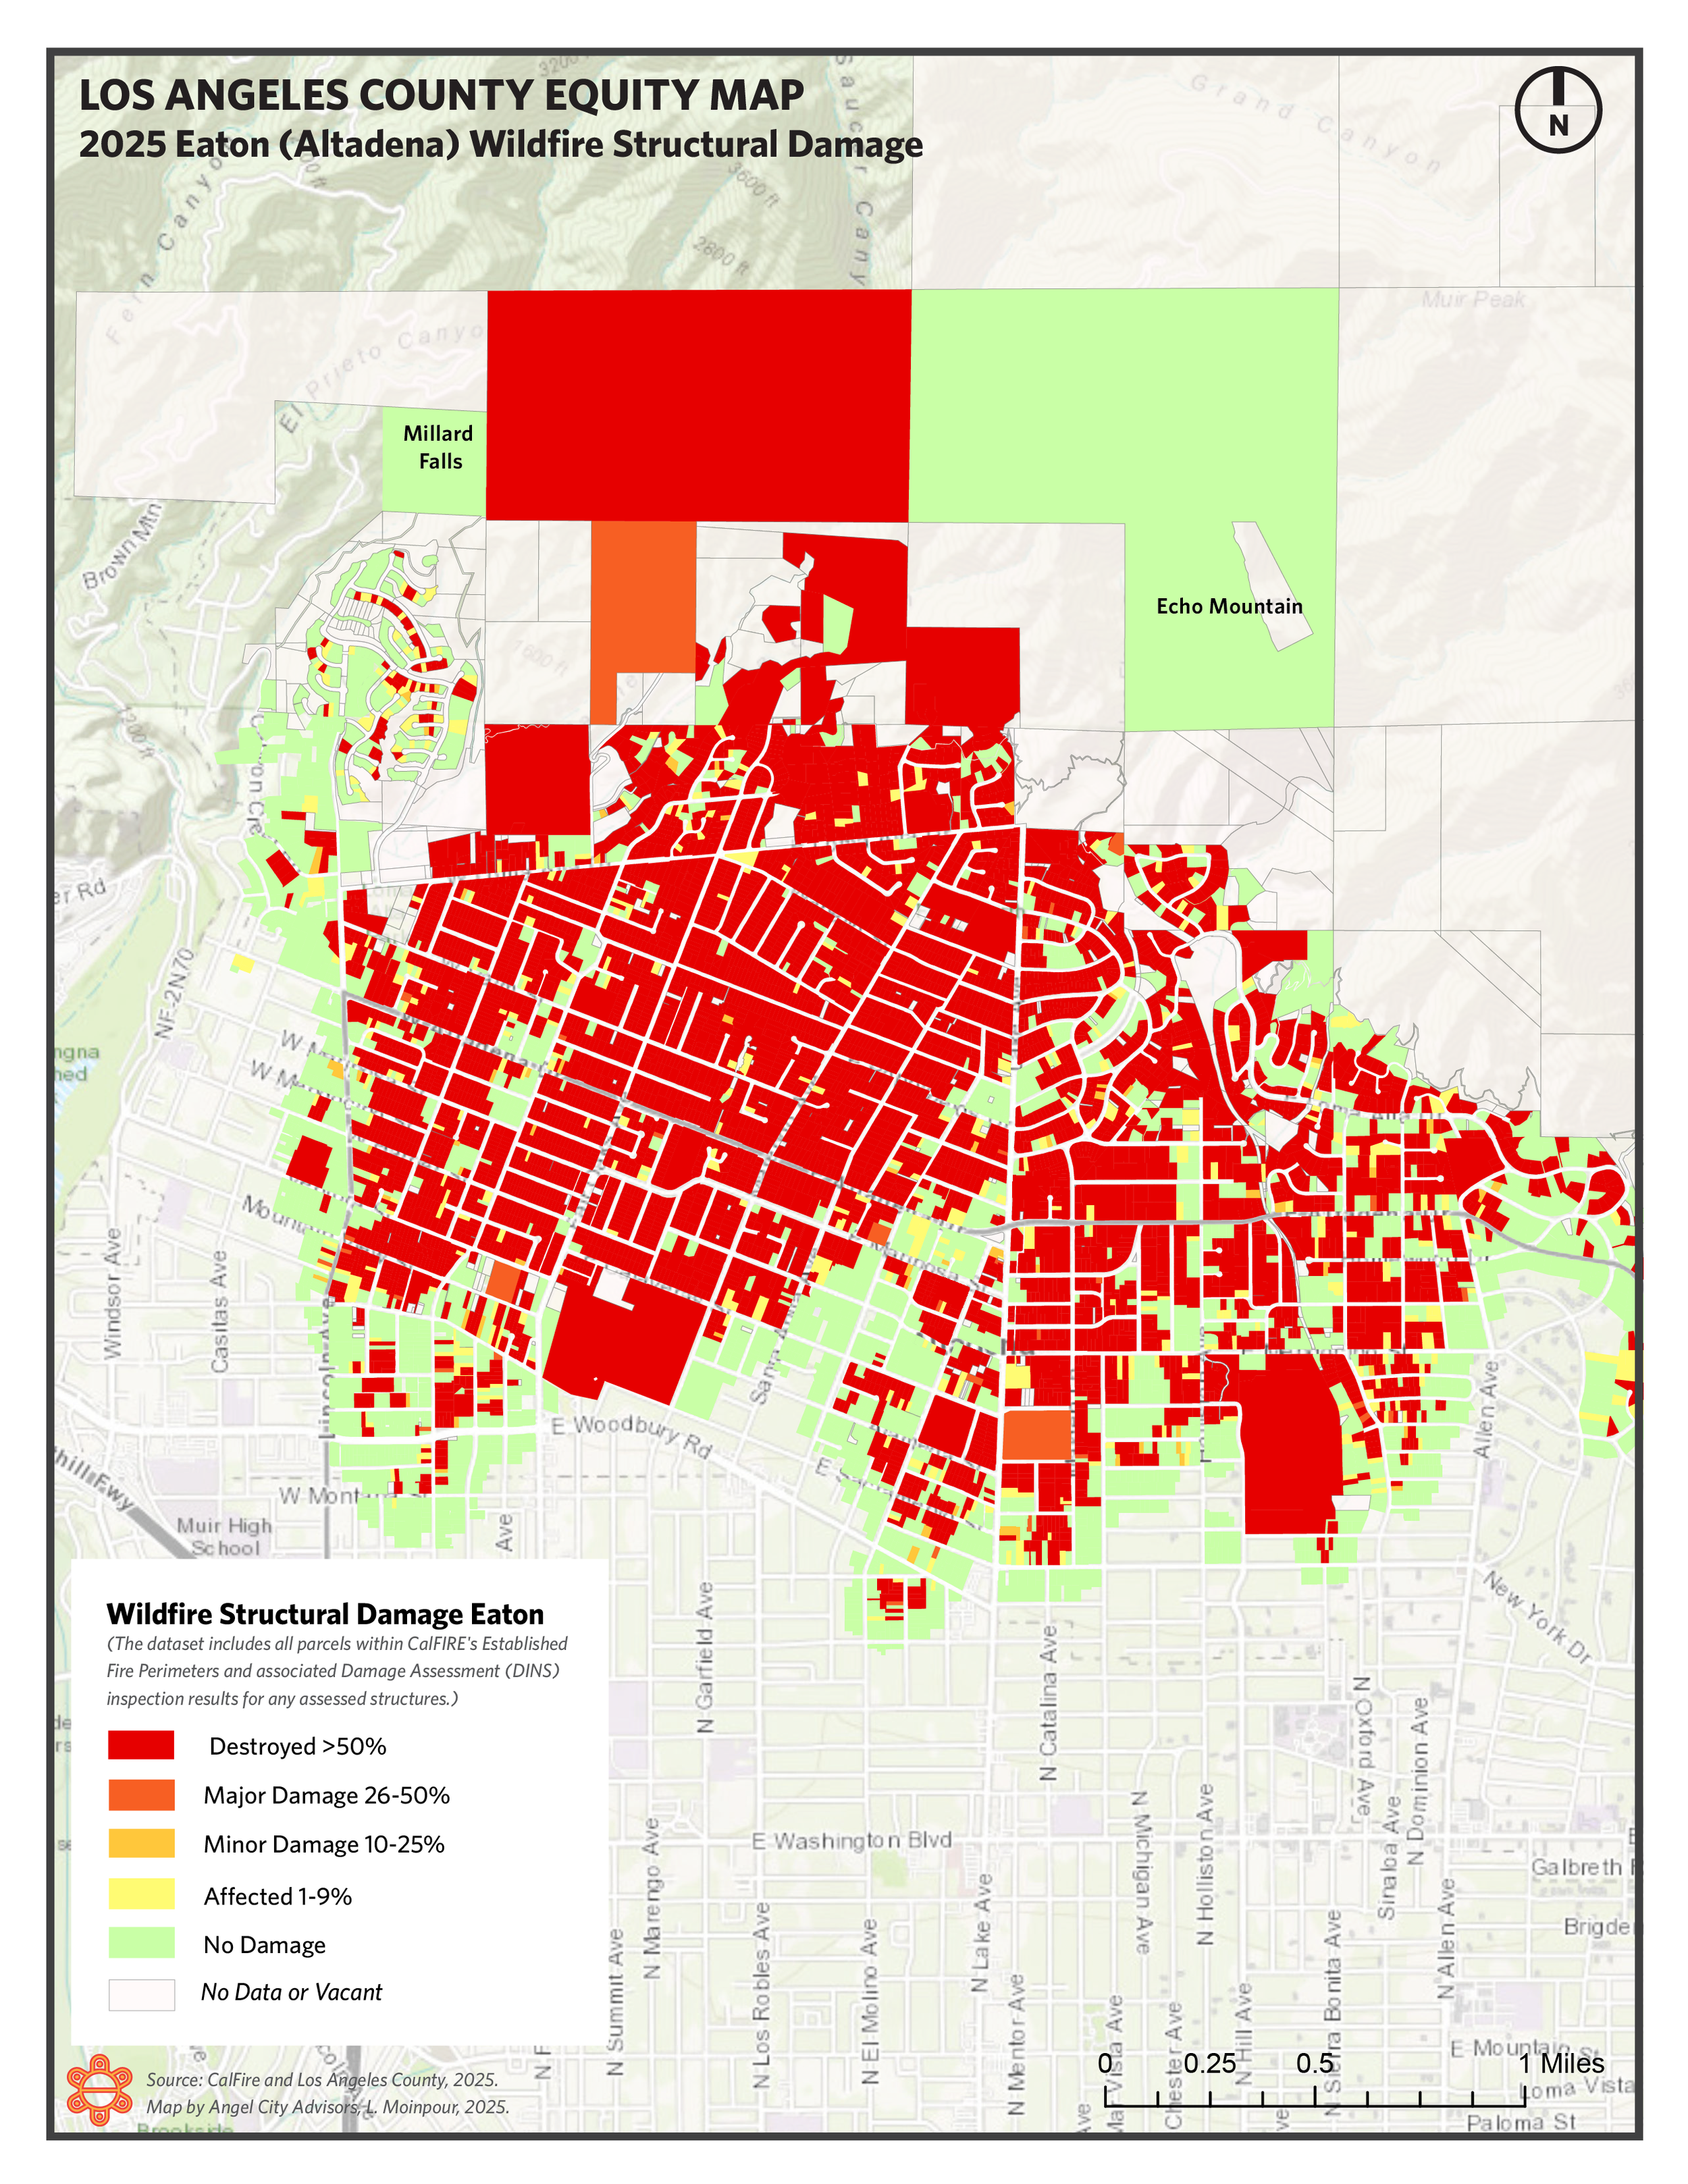
2025 Eaton (Altadena) Wildfire Structural Damage

2025 Eaton (Pasadena/Sierra Madra) Wildfire Structural Damage
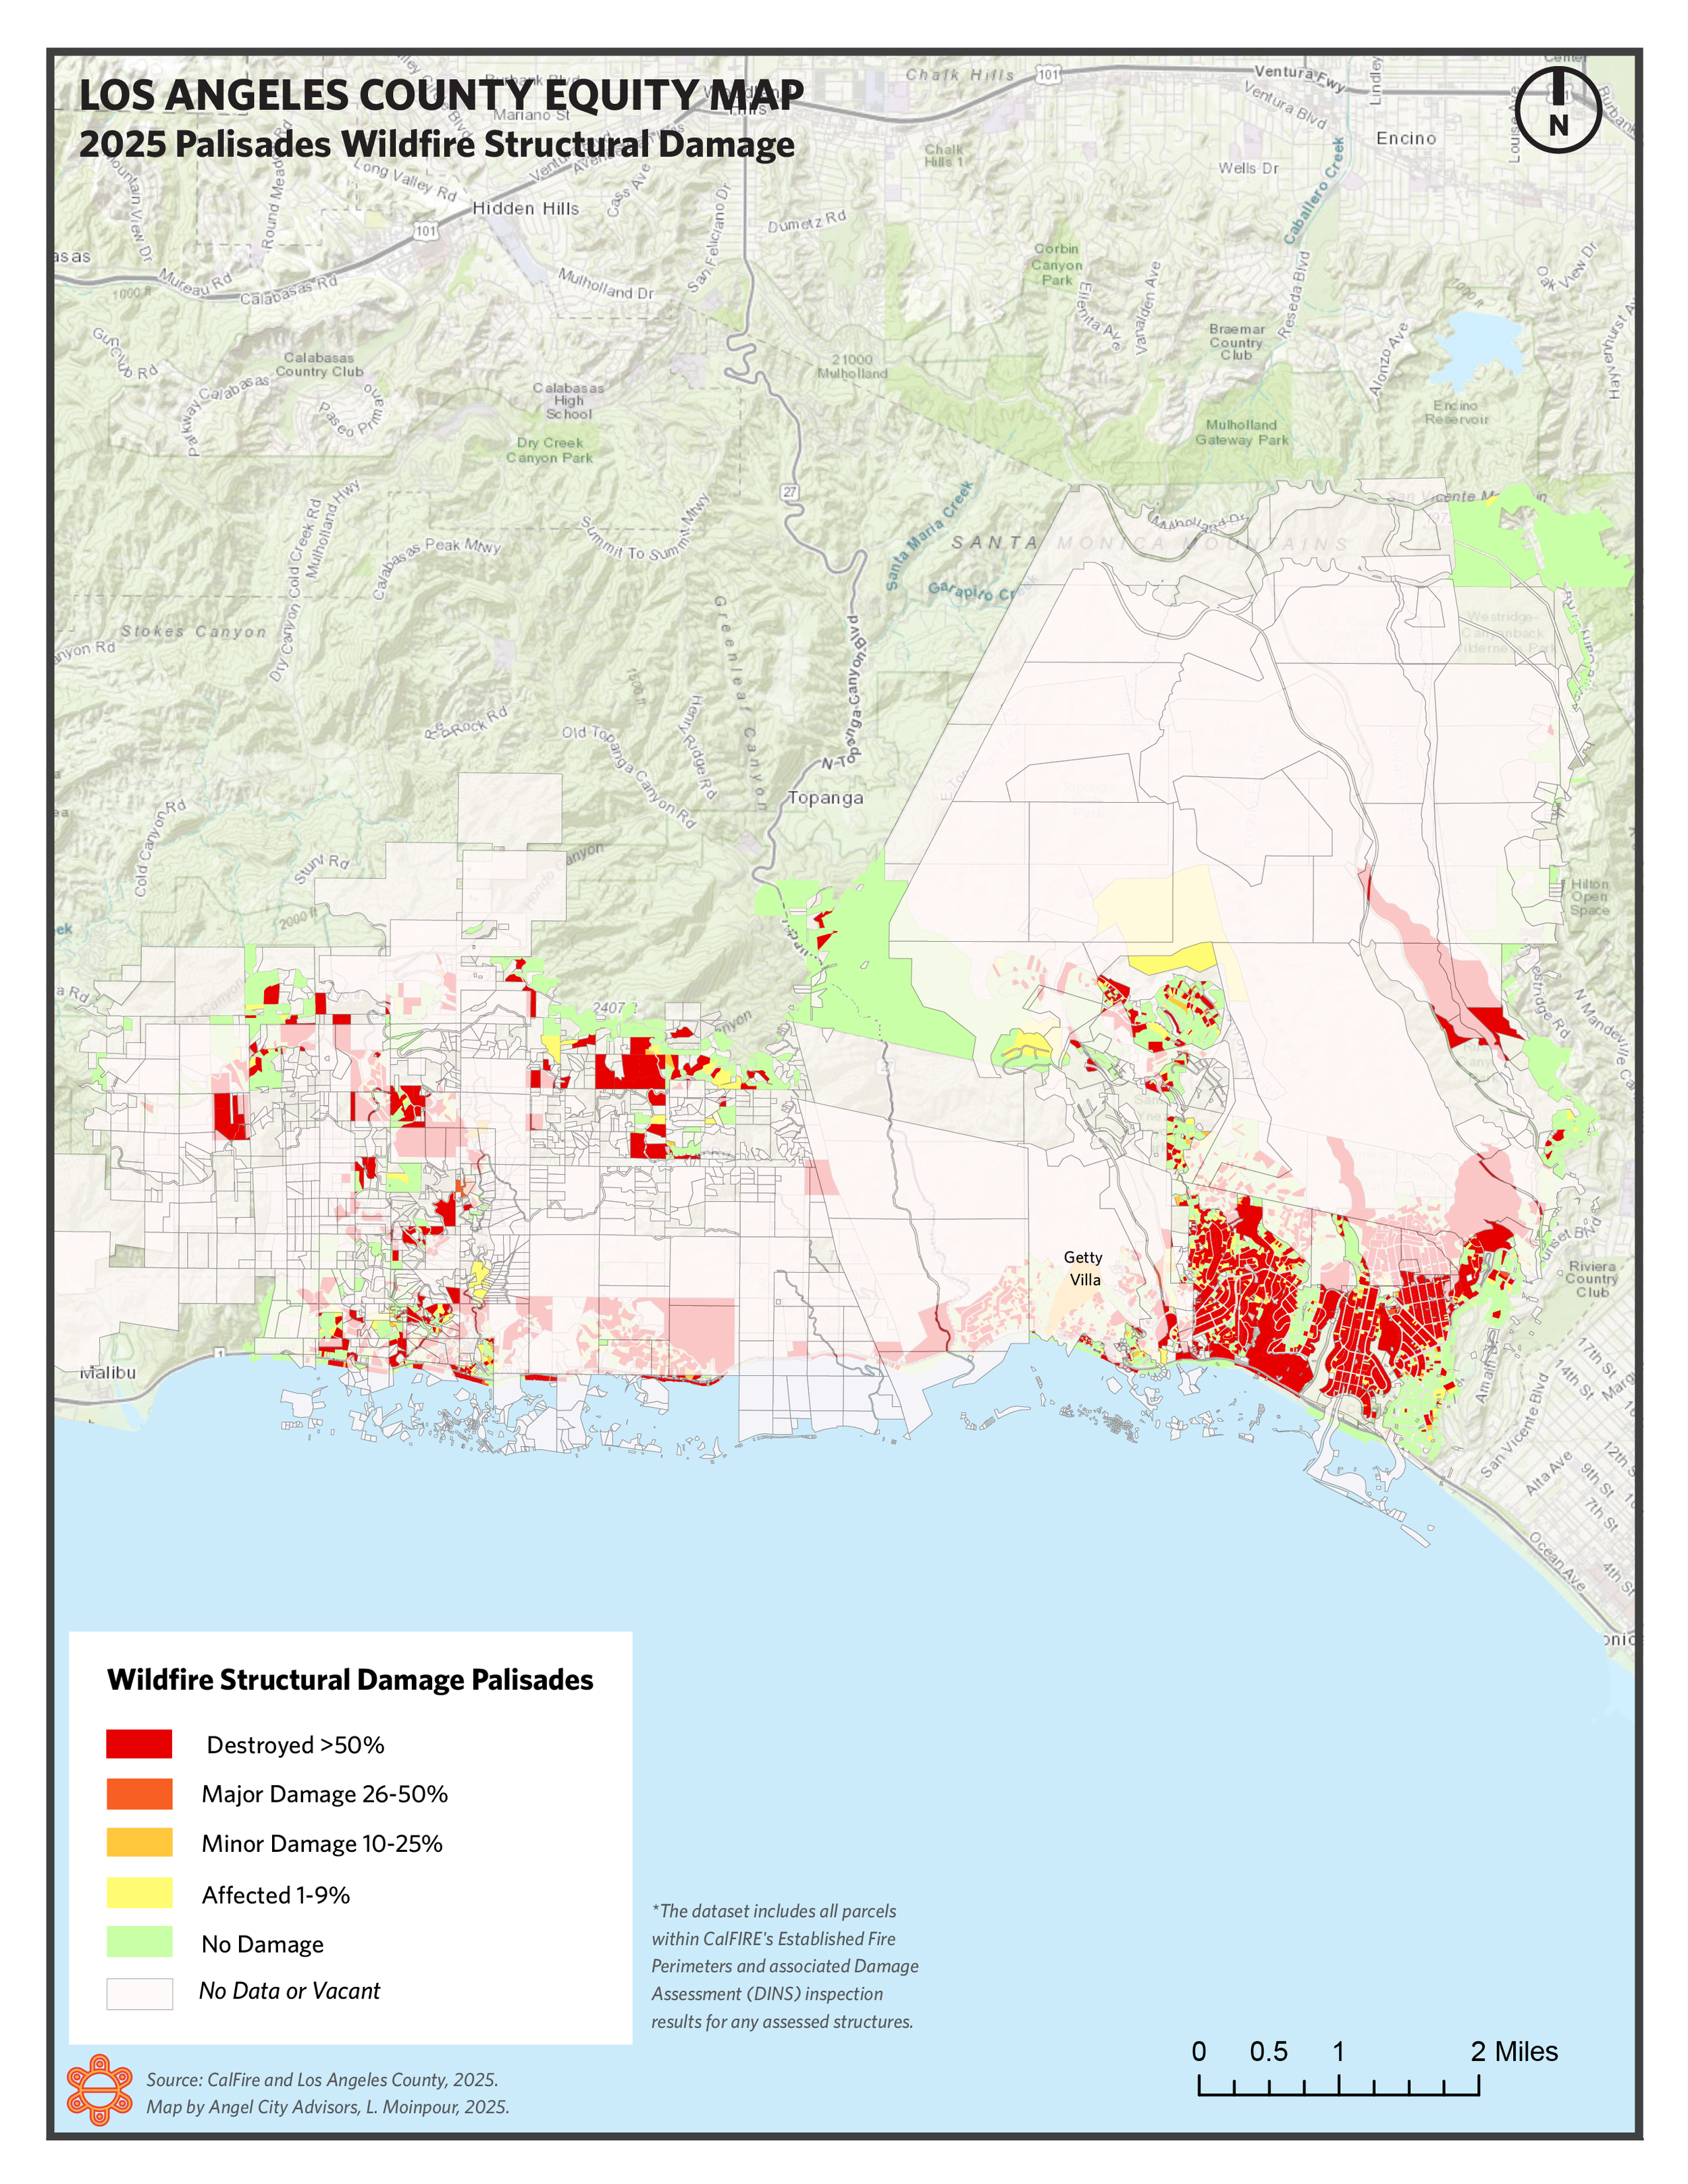
2025 Palisades Wildfire Structural Damage

2025 Palisades (Malibu) Wildfire Structural Damage

2025 Palisades Wildfire: Structural Damage Palisades
Structural / Immutable Disadvantages
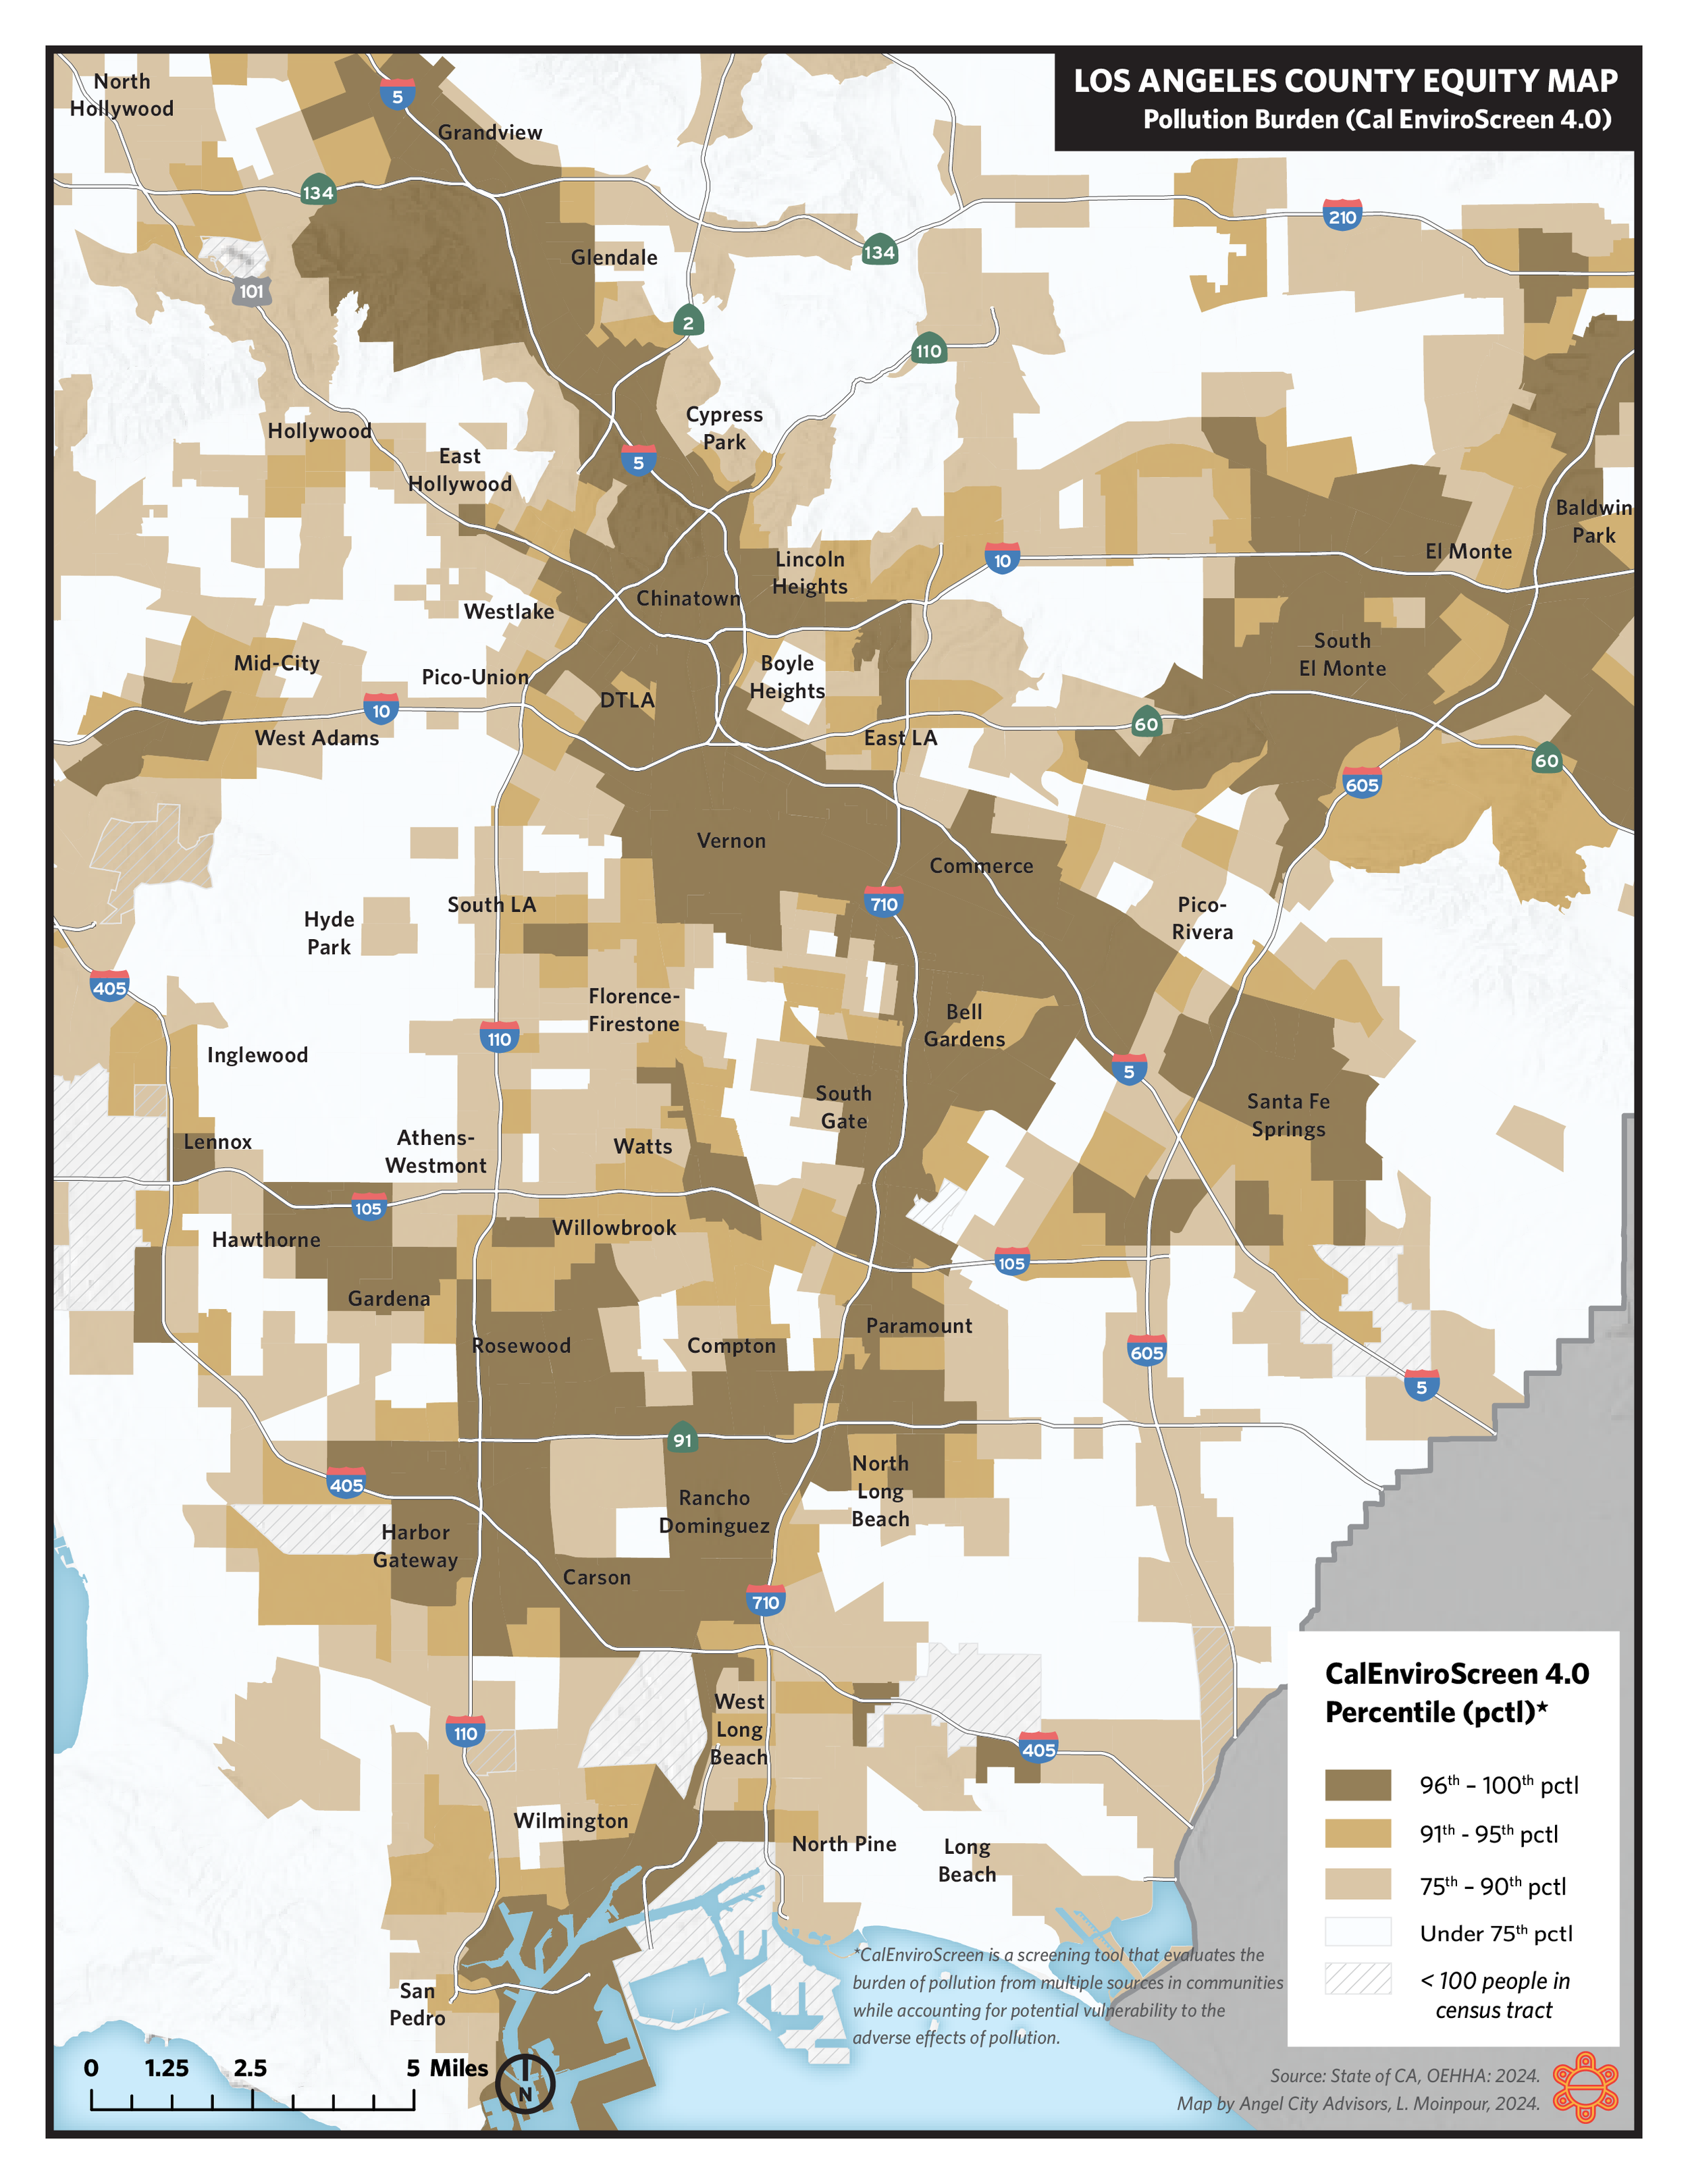
This grouping of maps uses data to visualize conditions indicating structural disadvantages such as environmental (in)justice, racially concentrated poverty, linguistic isolation, redlining, and criminal (in)justice. We offer Countywide maps, as well as zoom-ins on the most impacted areas.
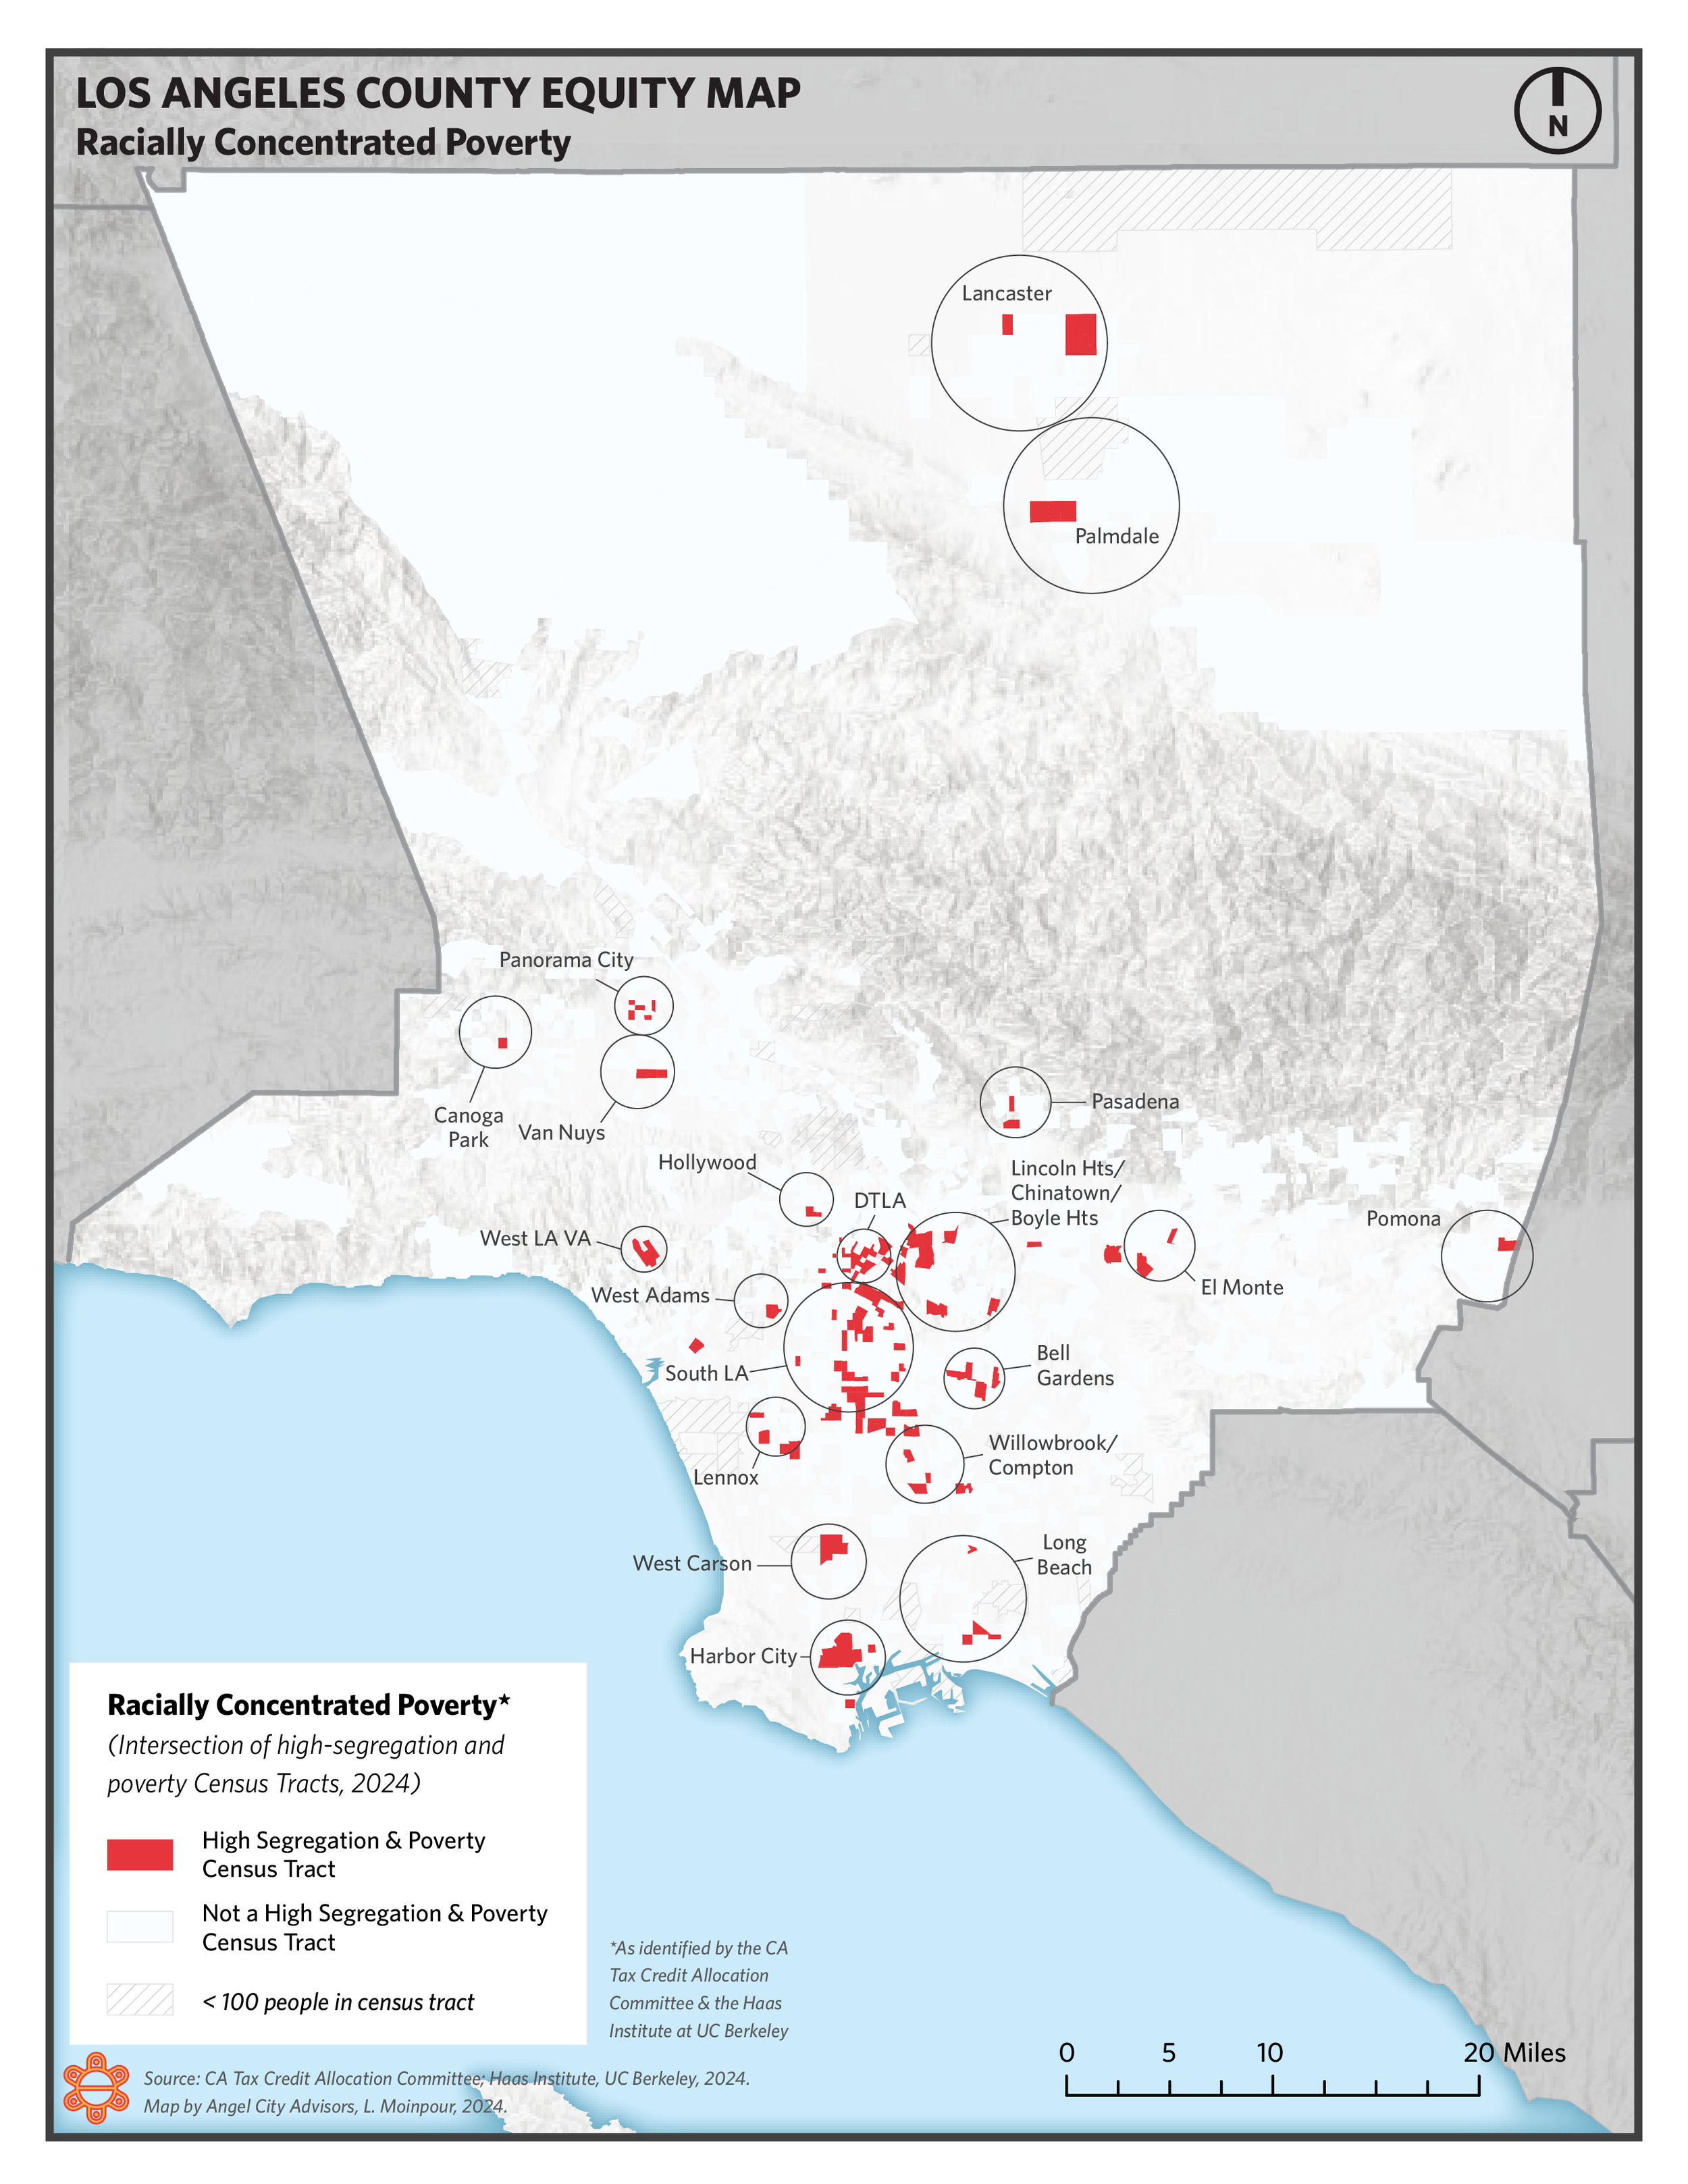
Racially-concentrated Poverty

Racially-concentrated Poverty, zoom-in

Pollution Burden
Pollution Burden, zoom-in
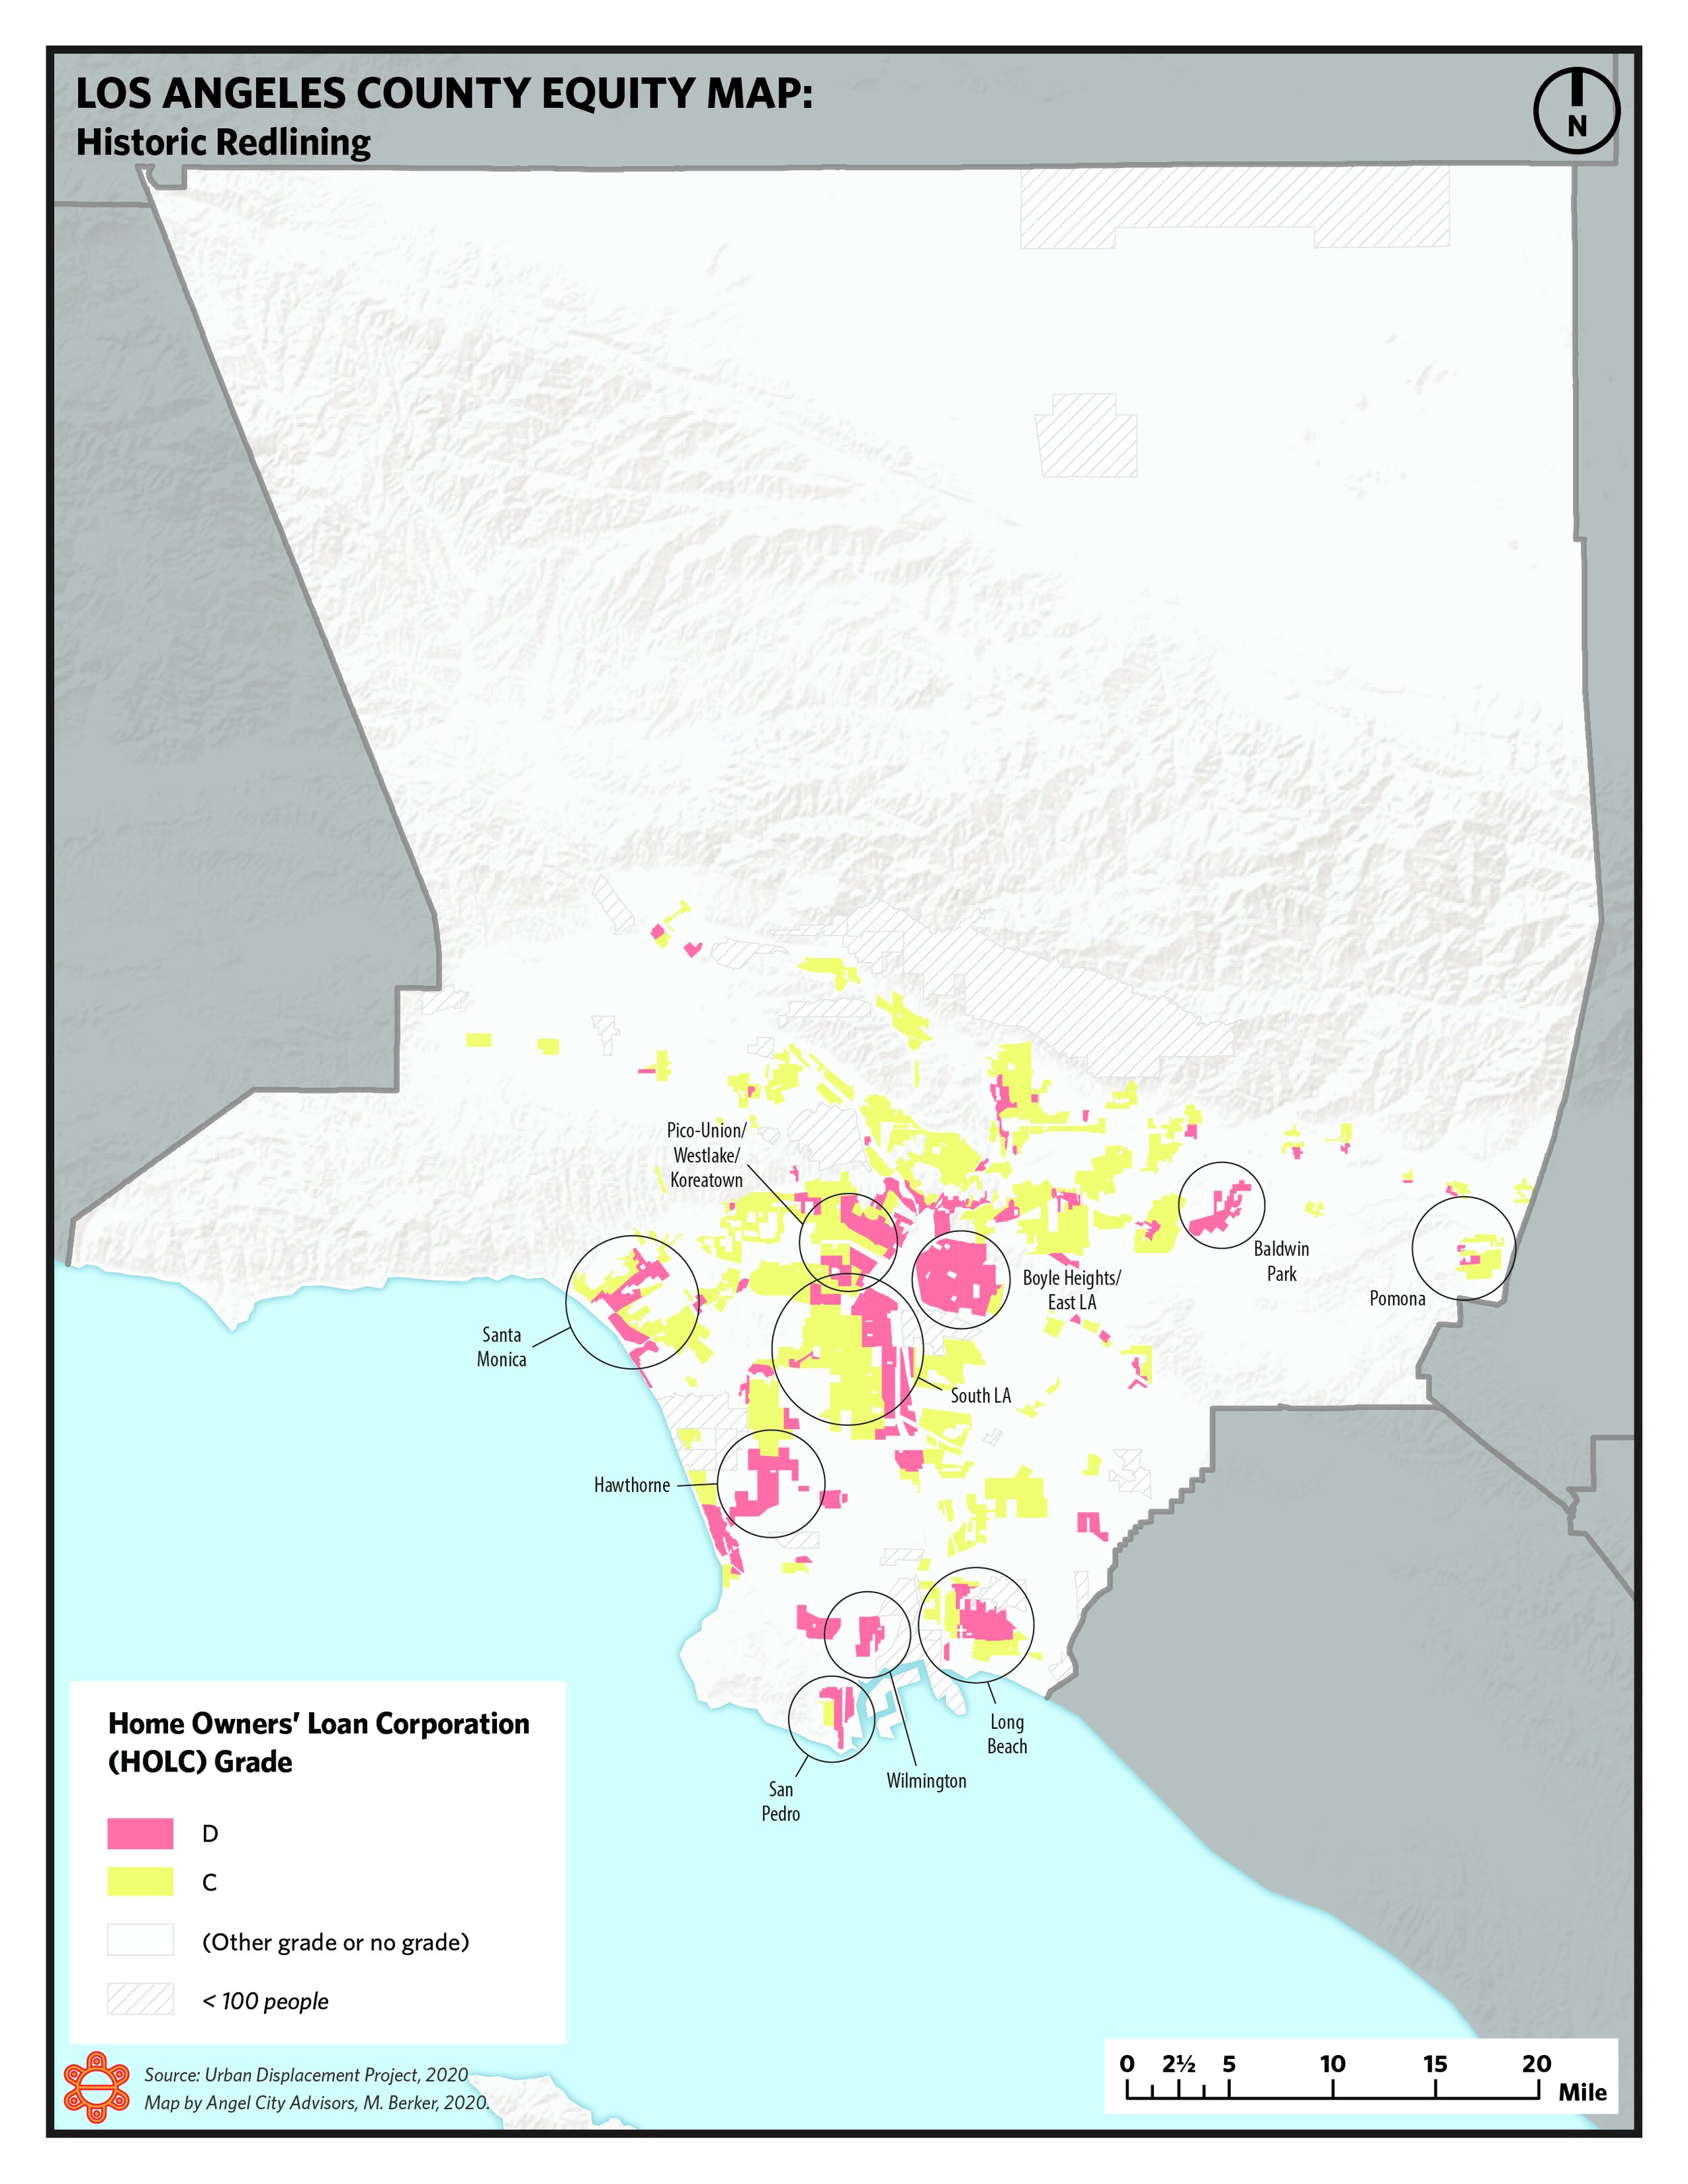
Historic Redlining

Historic Redlining, zoom-in
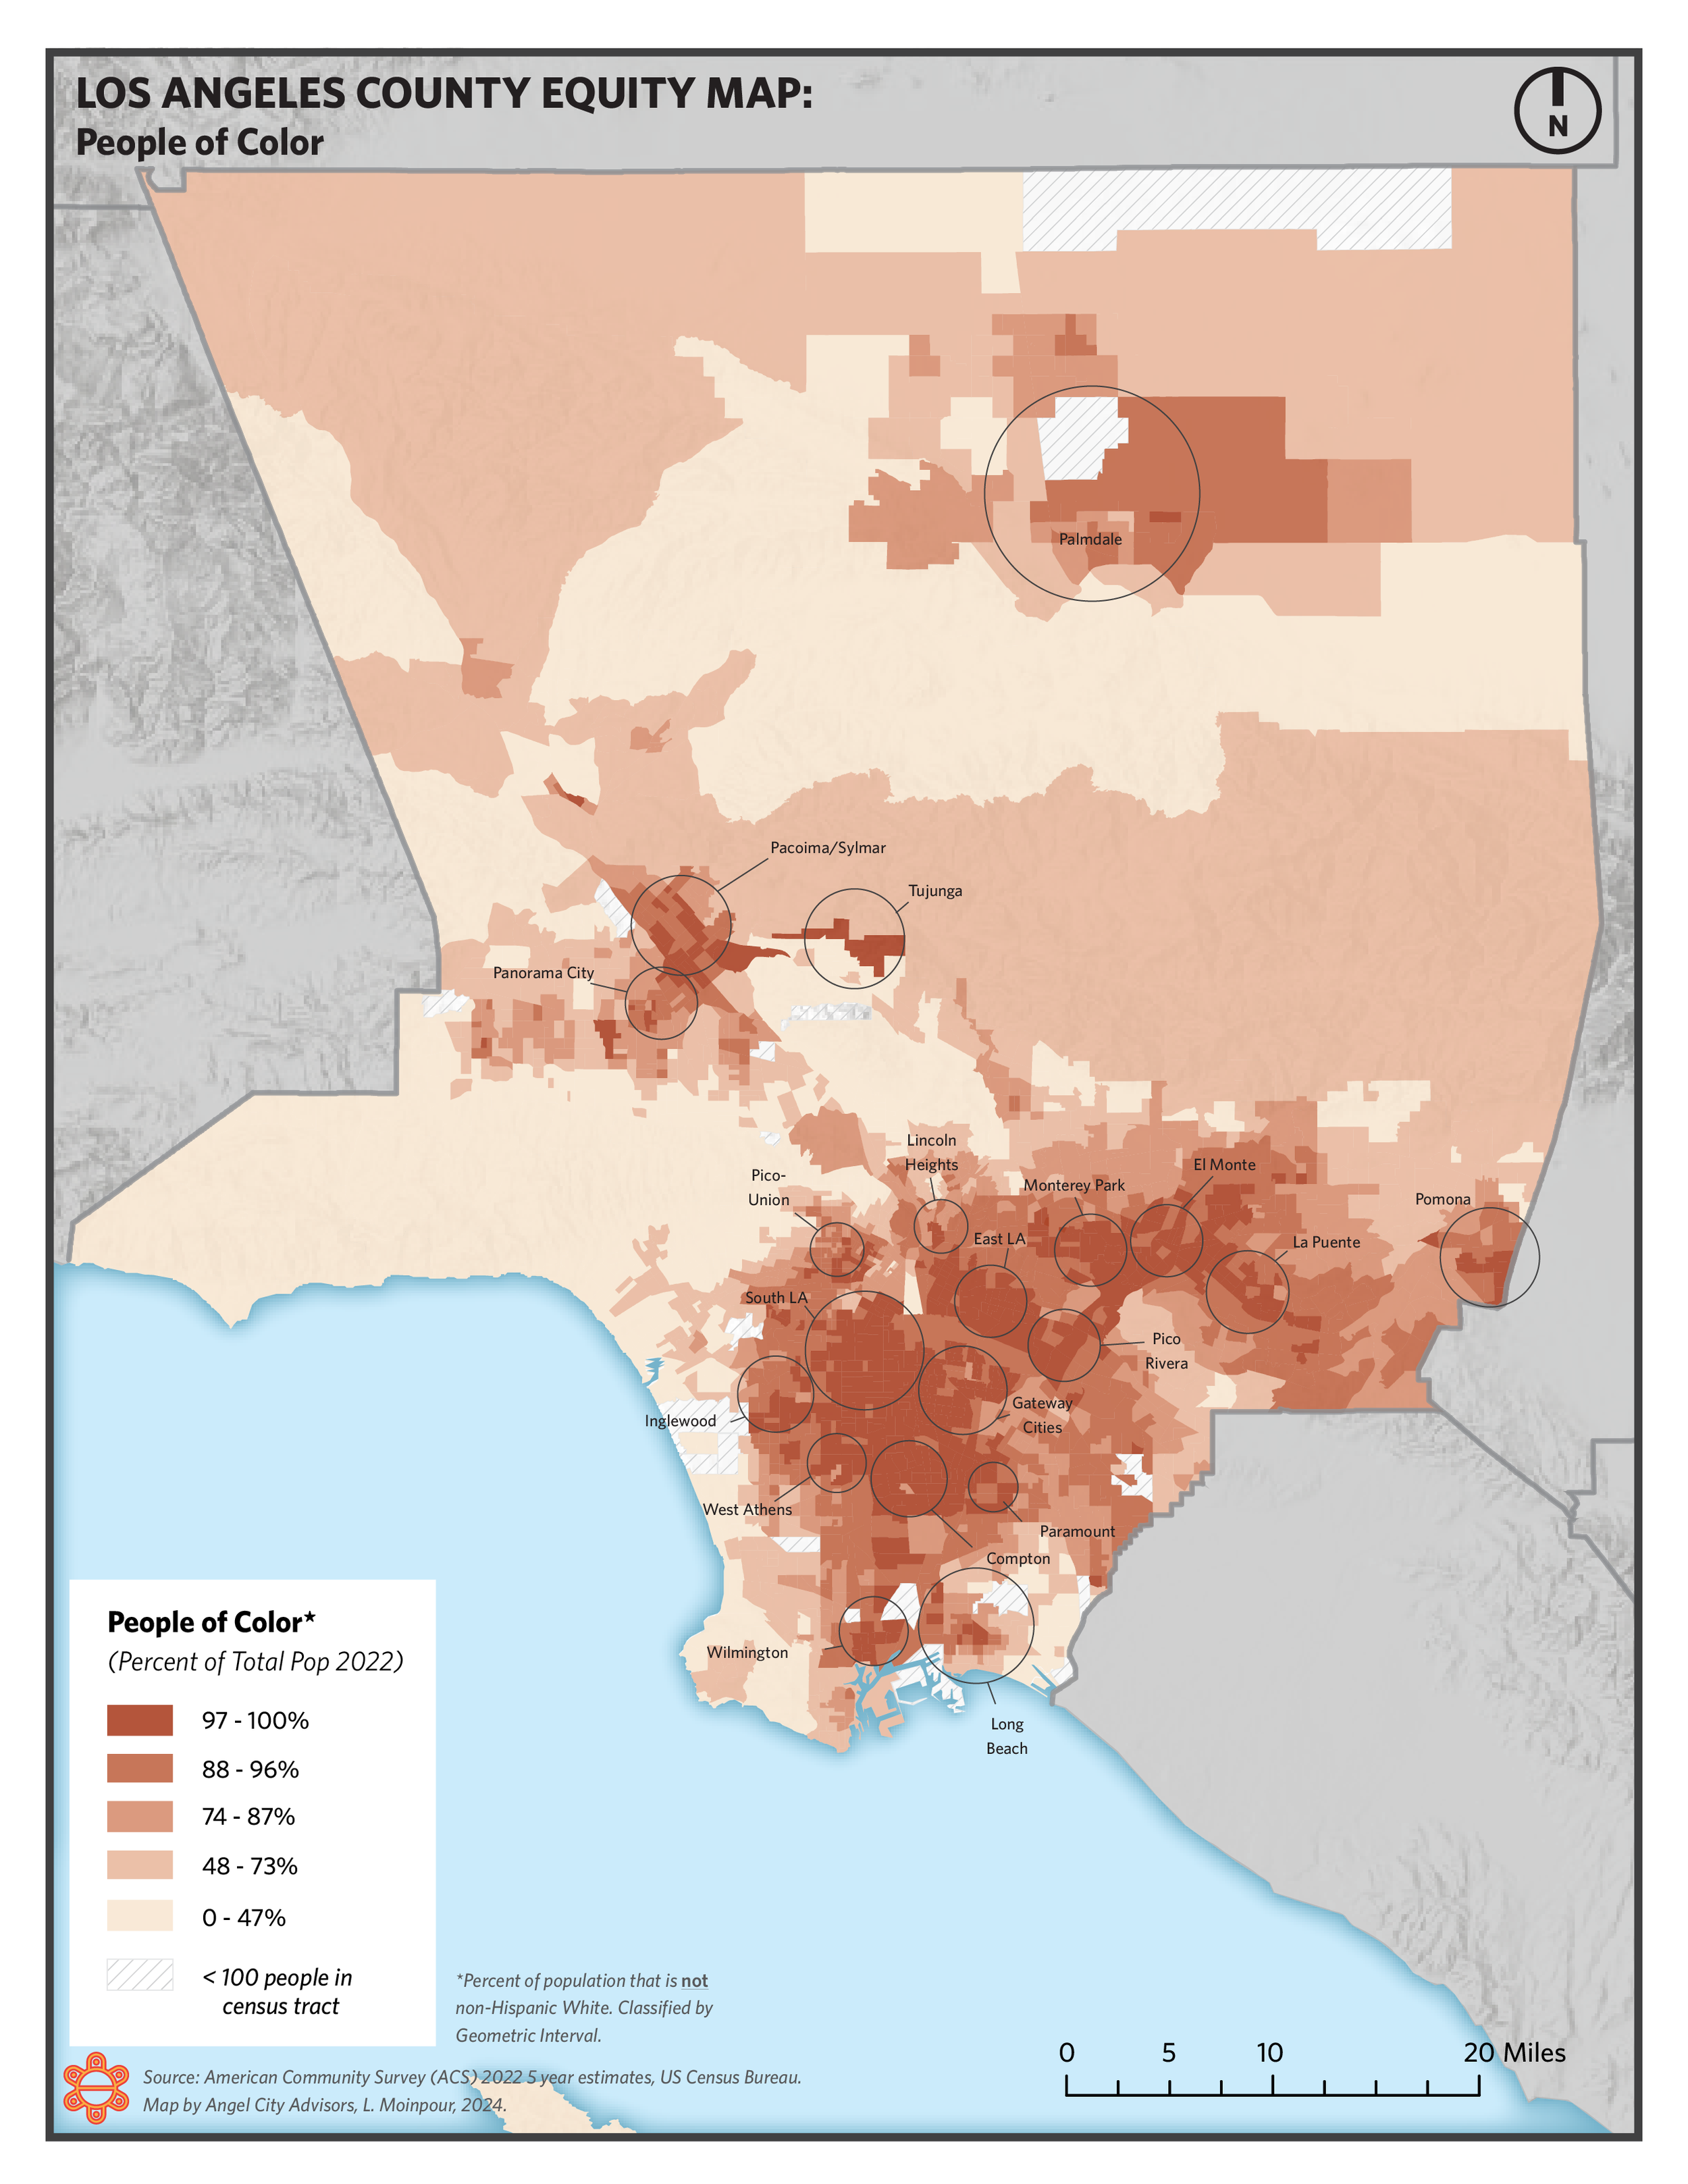
People of Color (BIPOC)

People of Color (BIPOC), zoom-in
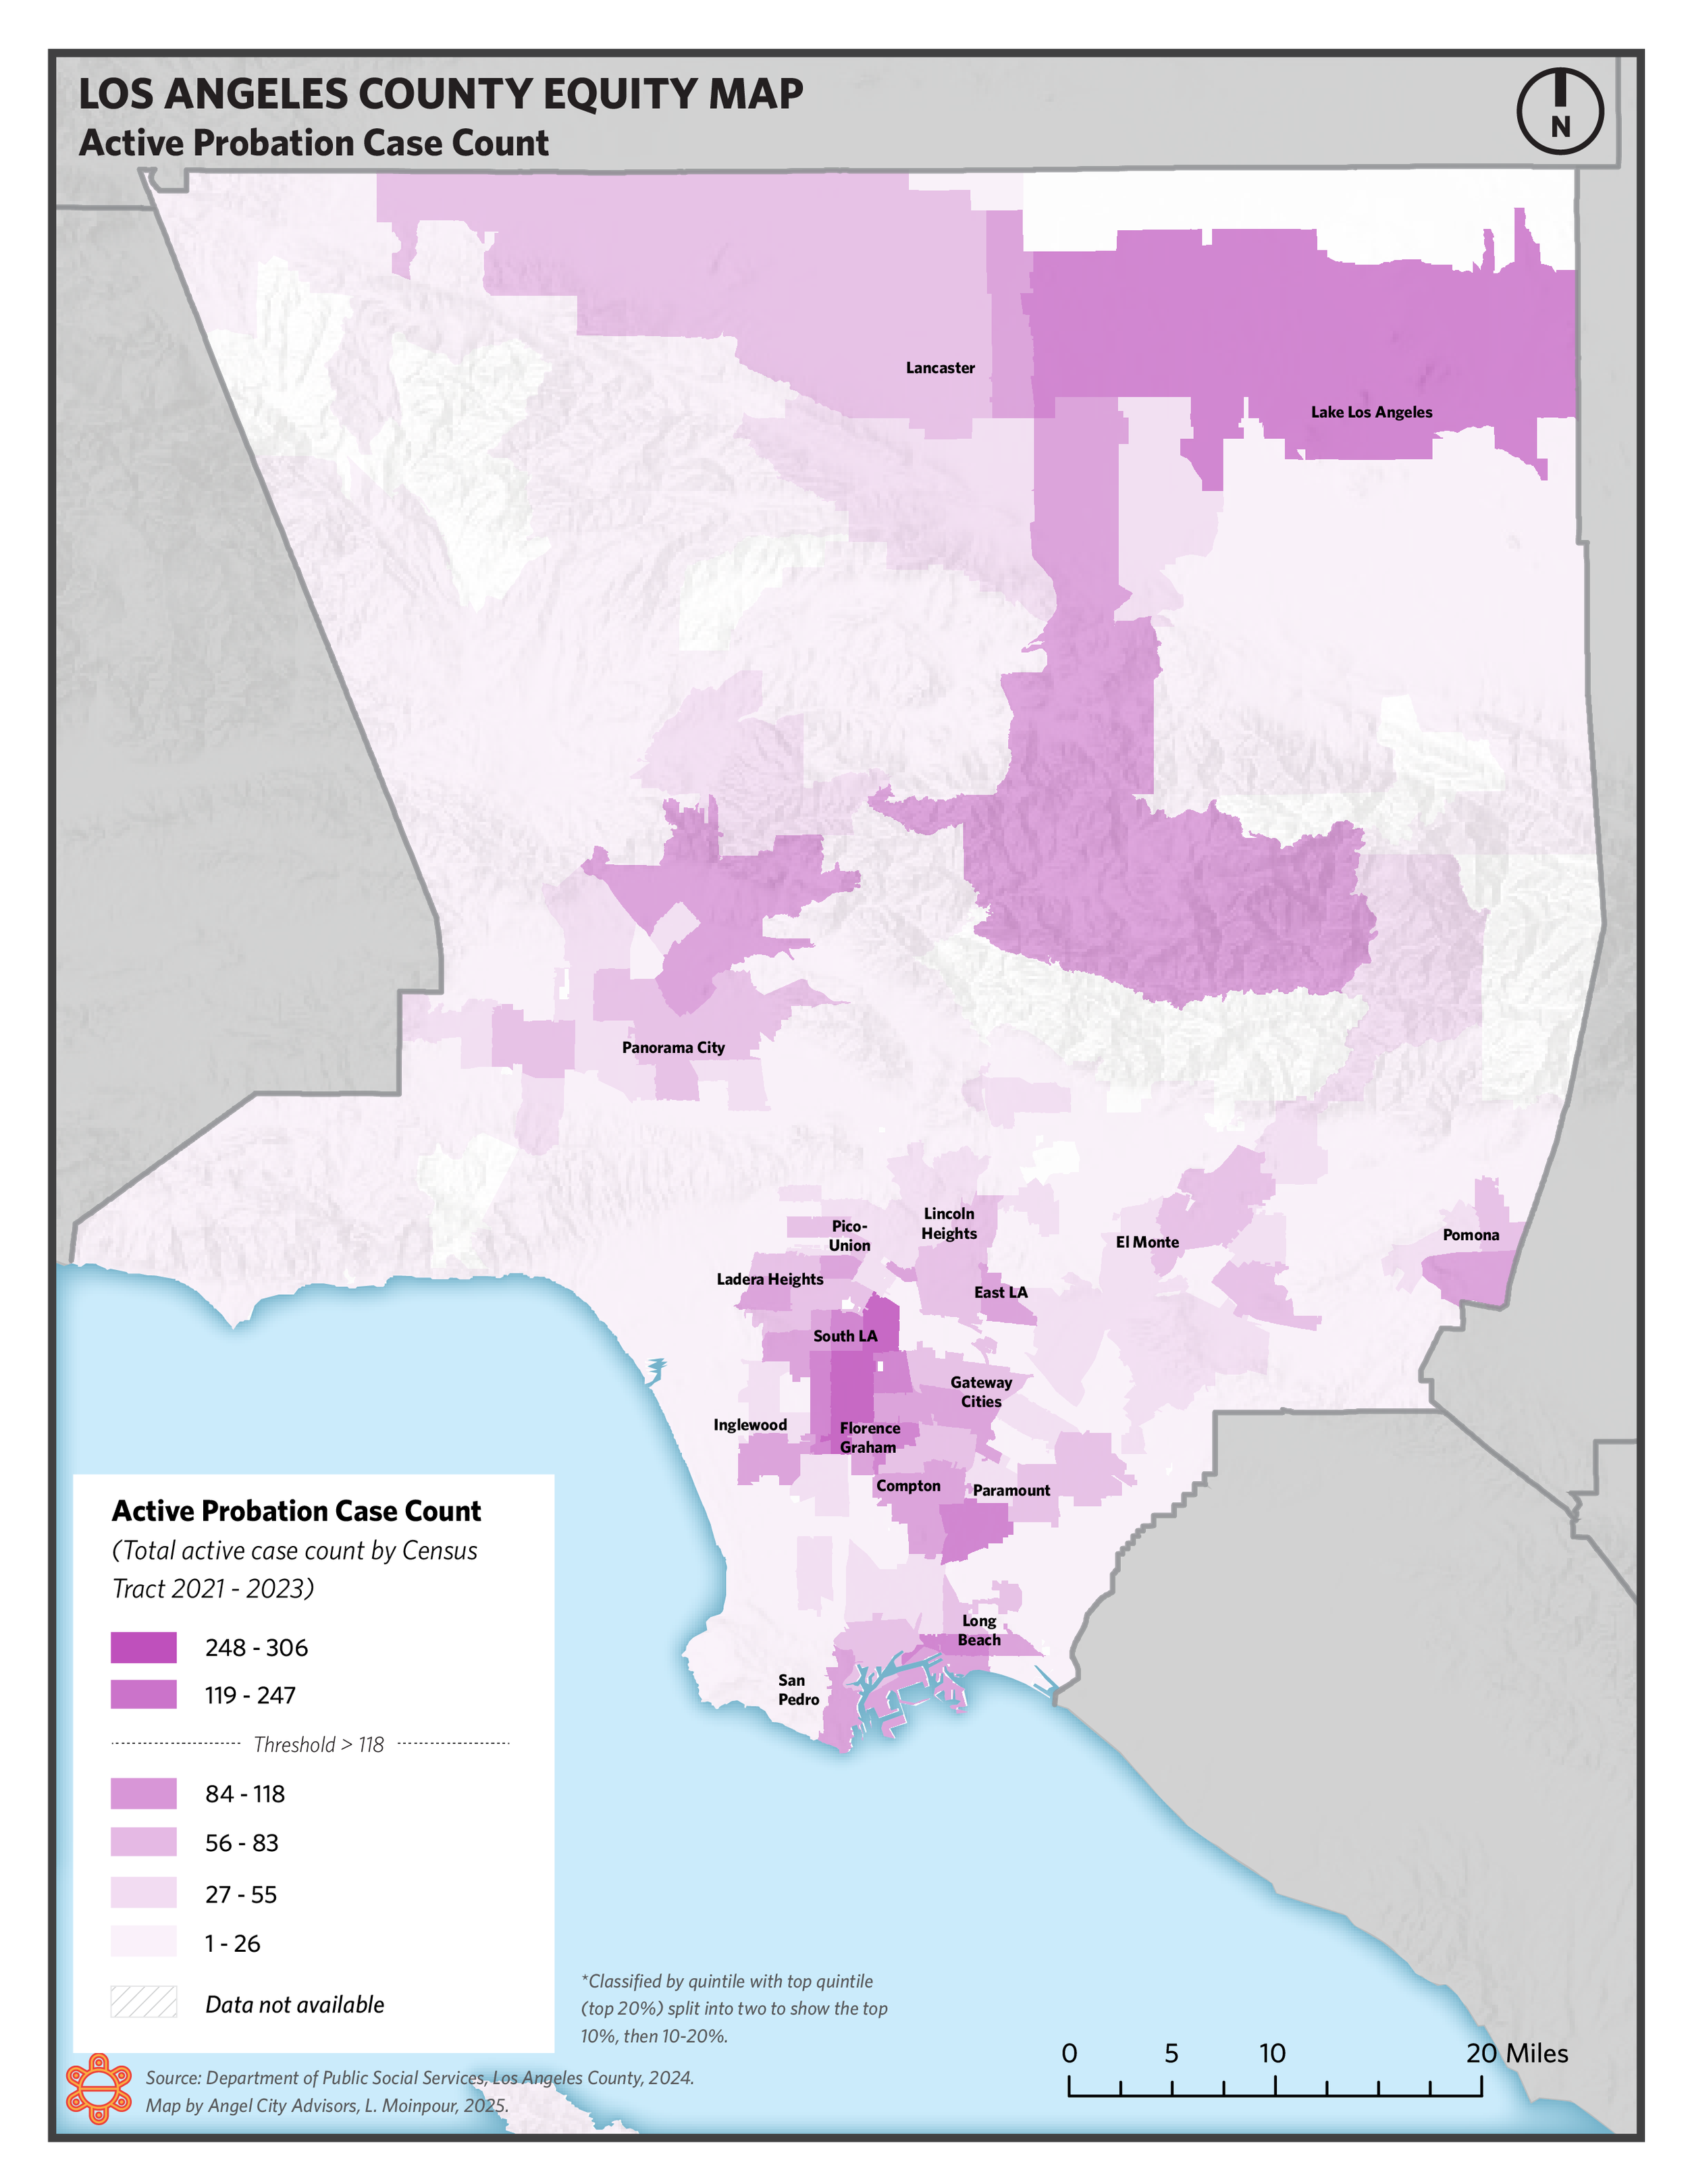
Active Probation Cases (counts)

Active Probation Cases (counts), zoom-in

Active Probation Cases (density)

Active Probation Cases (density), zoom-in
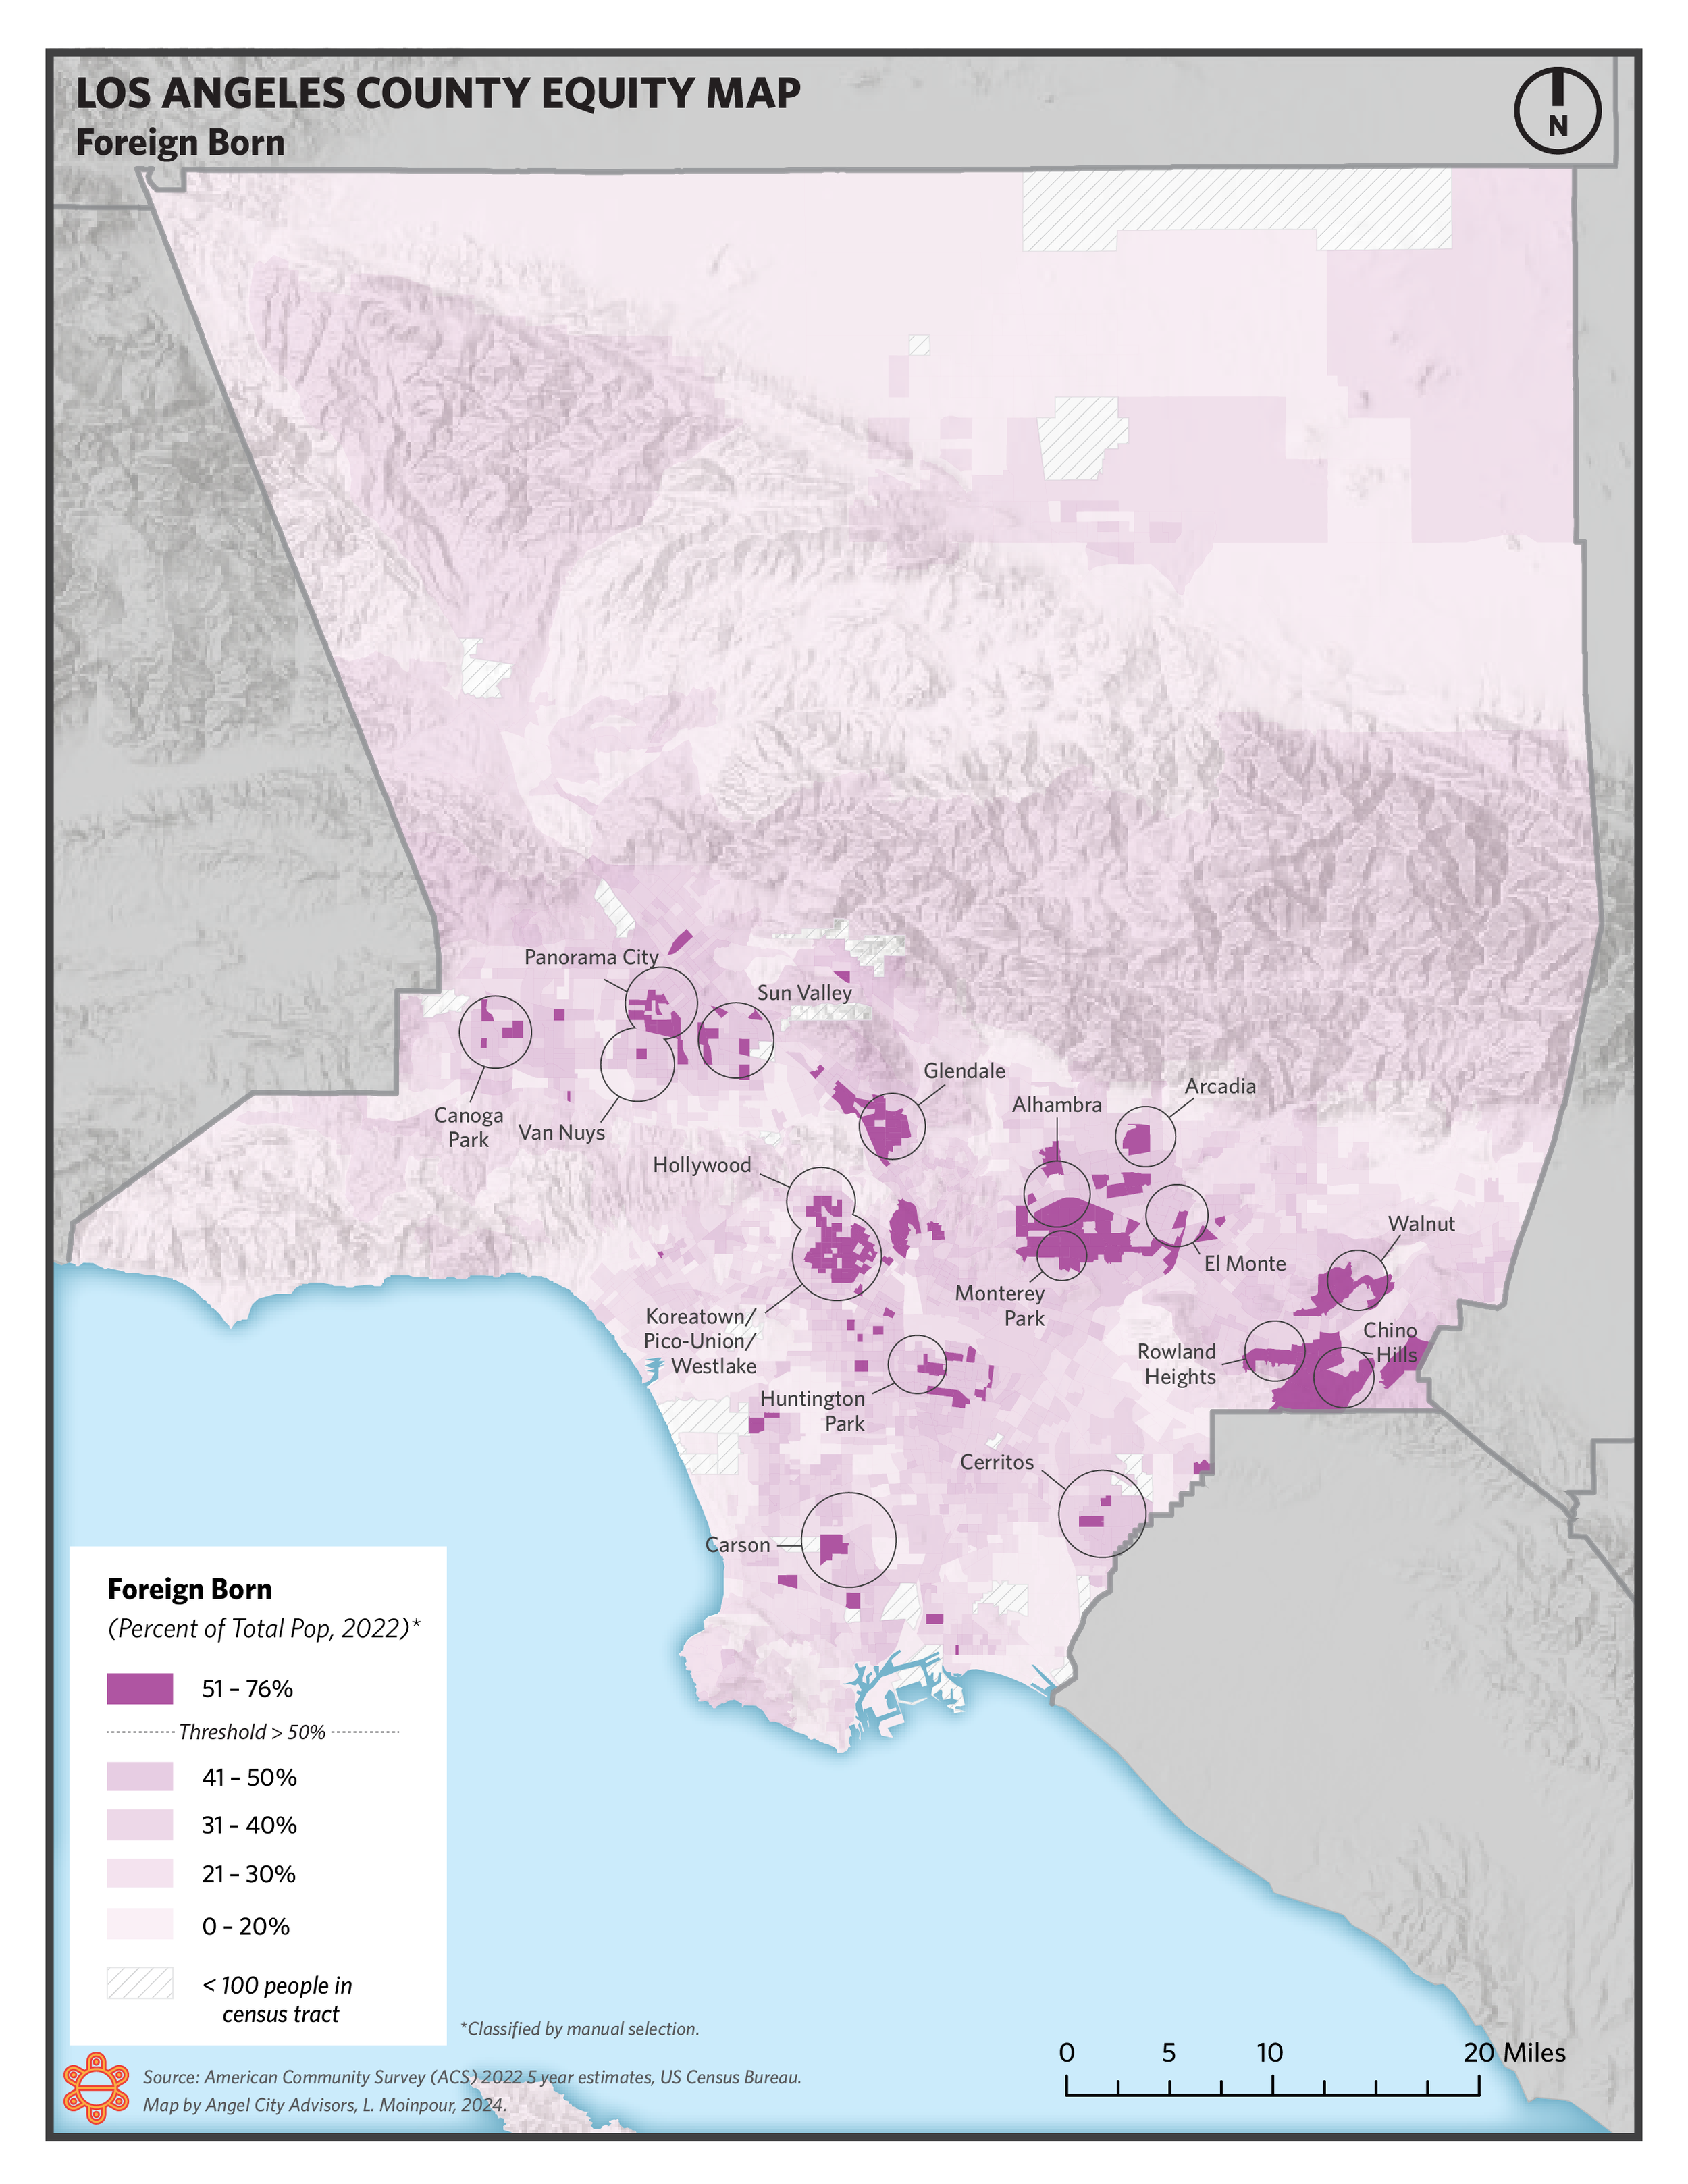
Foreign Born Populations

Foreign Born Populations, zoom-in
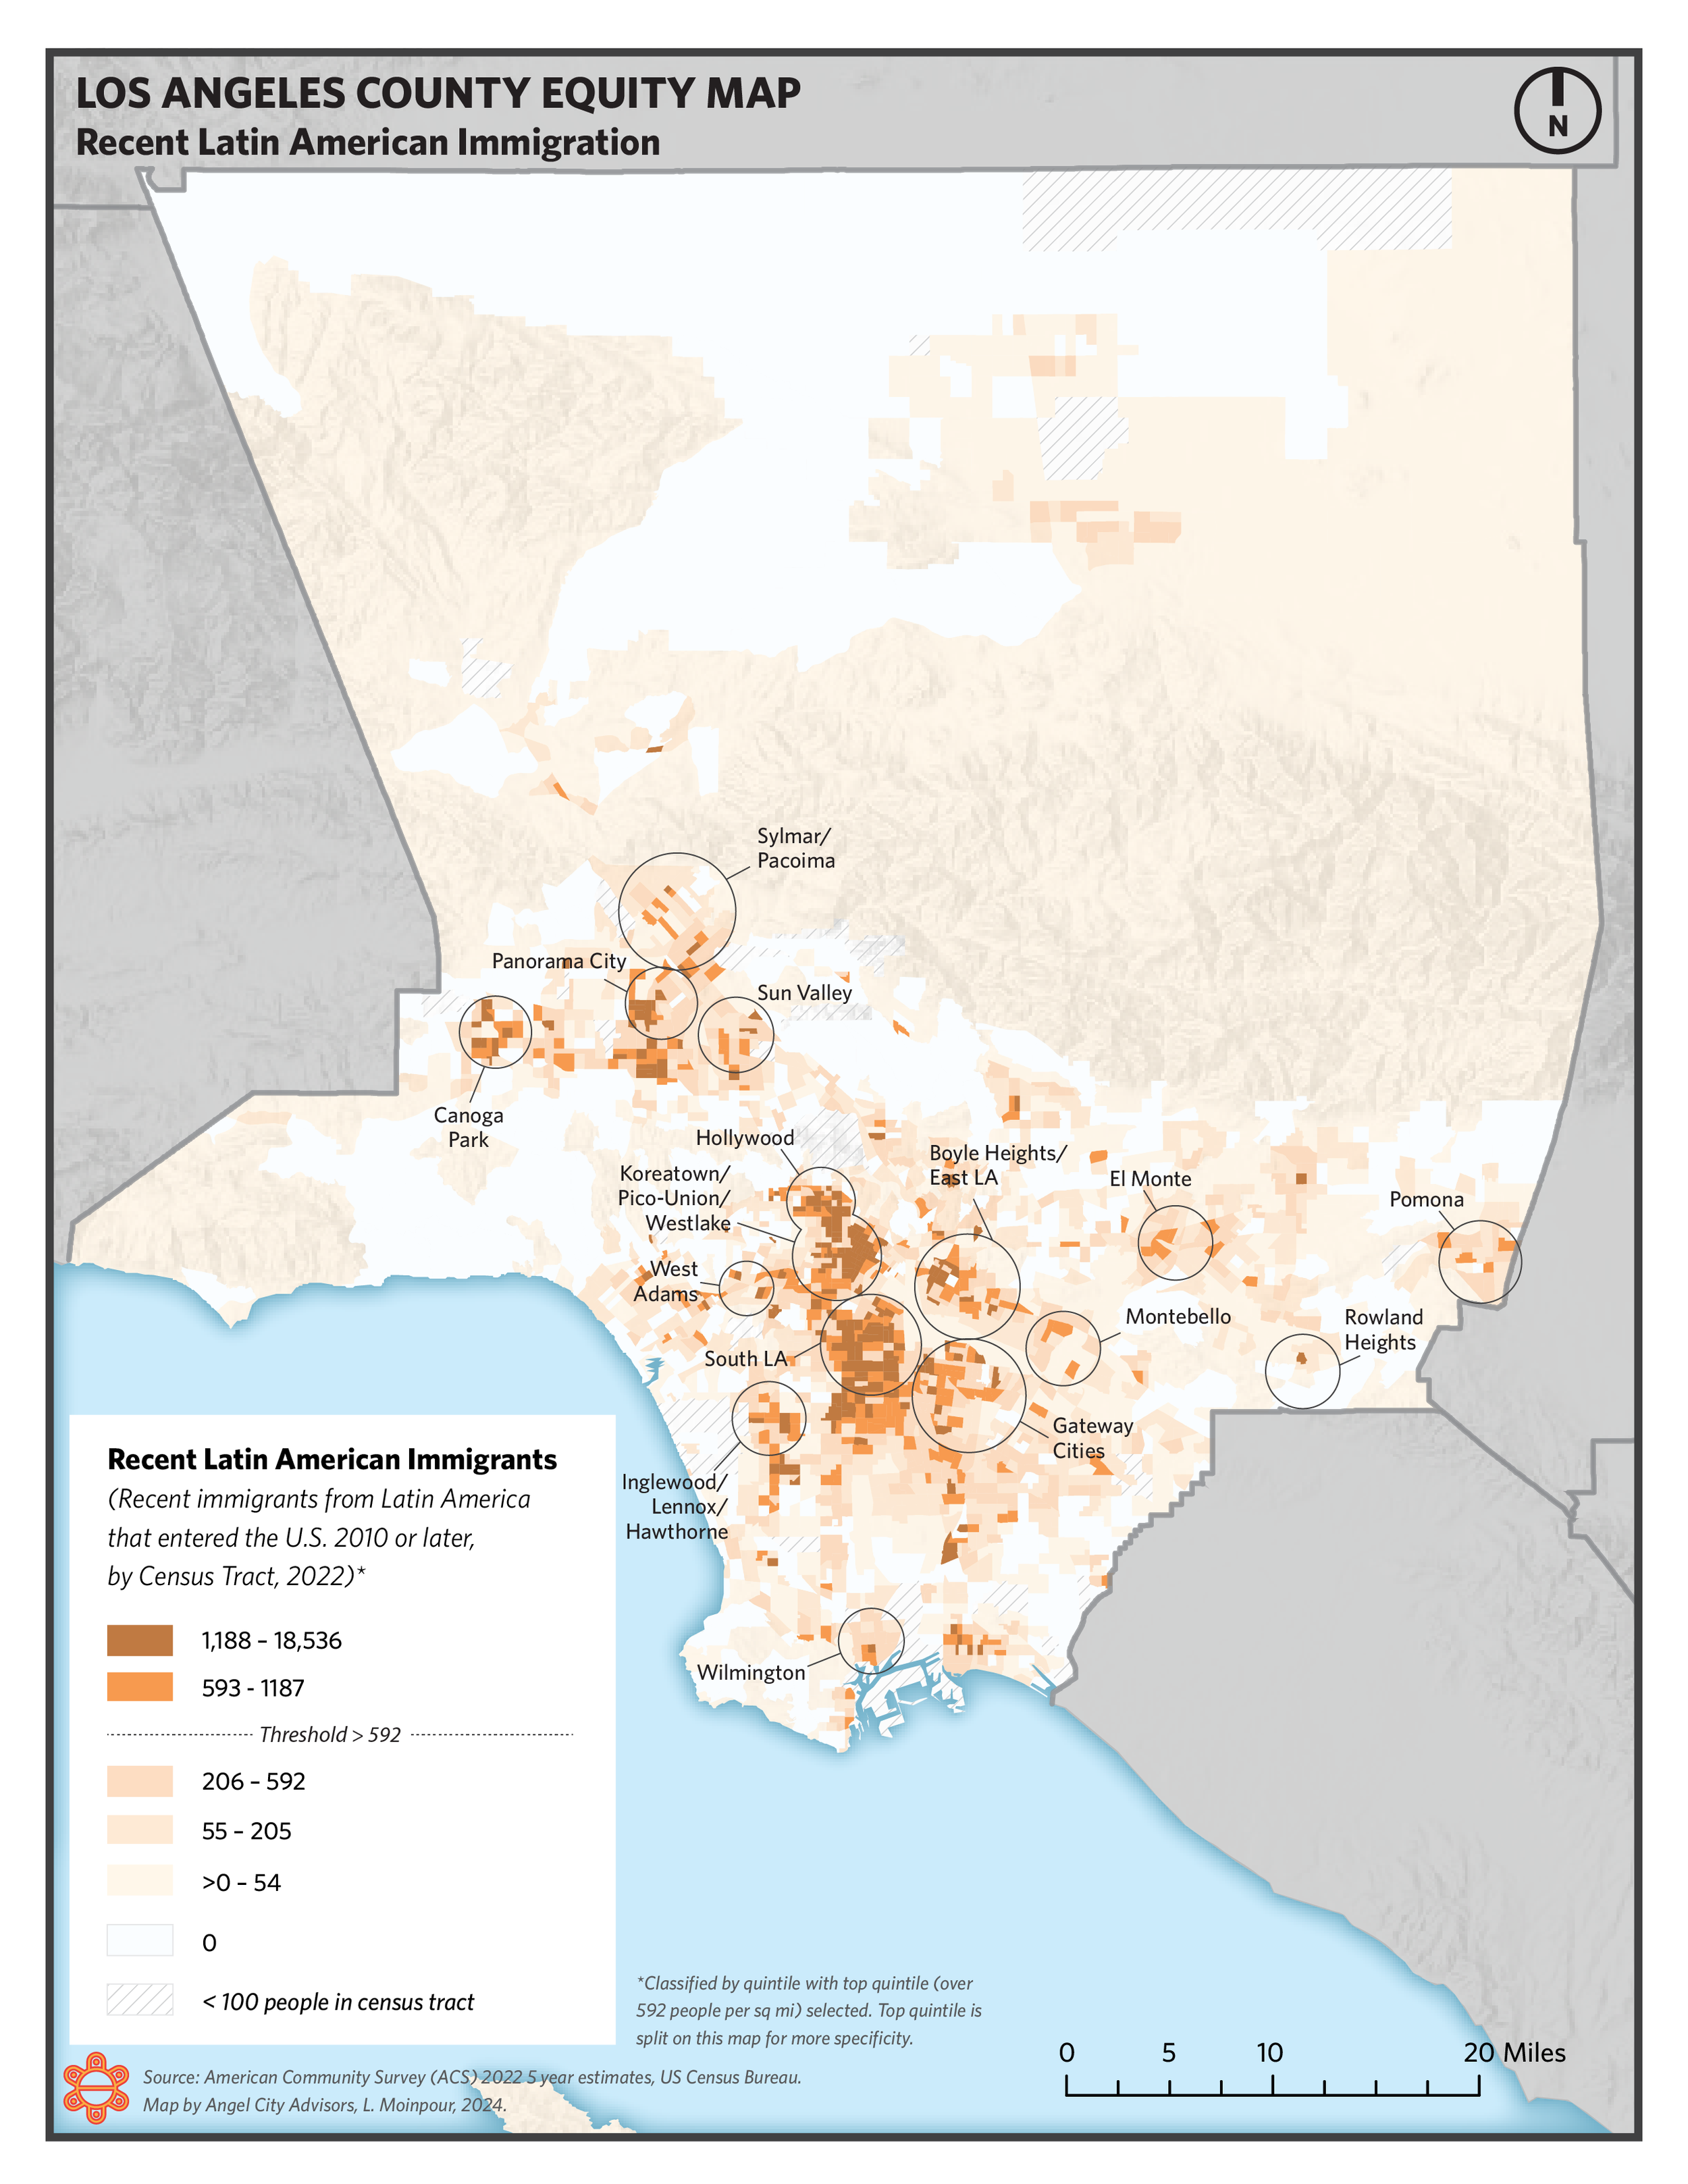
Recent Latin American Immigrants

Recent Latin American Immigrants, zoom-in

Limited English

Limited English, zoom-in

Age Vulnerability

Age Vulnerability, zoom-in

Persons with Disability

Persons with Disability, zoom-in
Current / Evolving Socioeconomic Disadvantage
This grouping of maps uses data to visualize more fluid conditions which may indicate neighborhood distress such as household income, educational attainment, unemployment, overcrowding, homelessness, and public benefit caseloads.

Median Household Income

Median Household Income, zoom-in
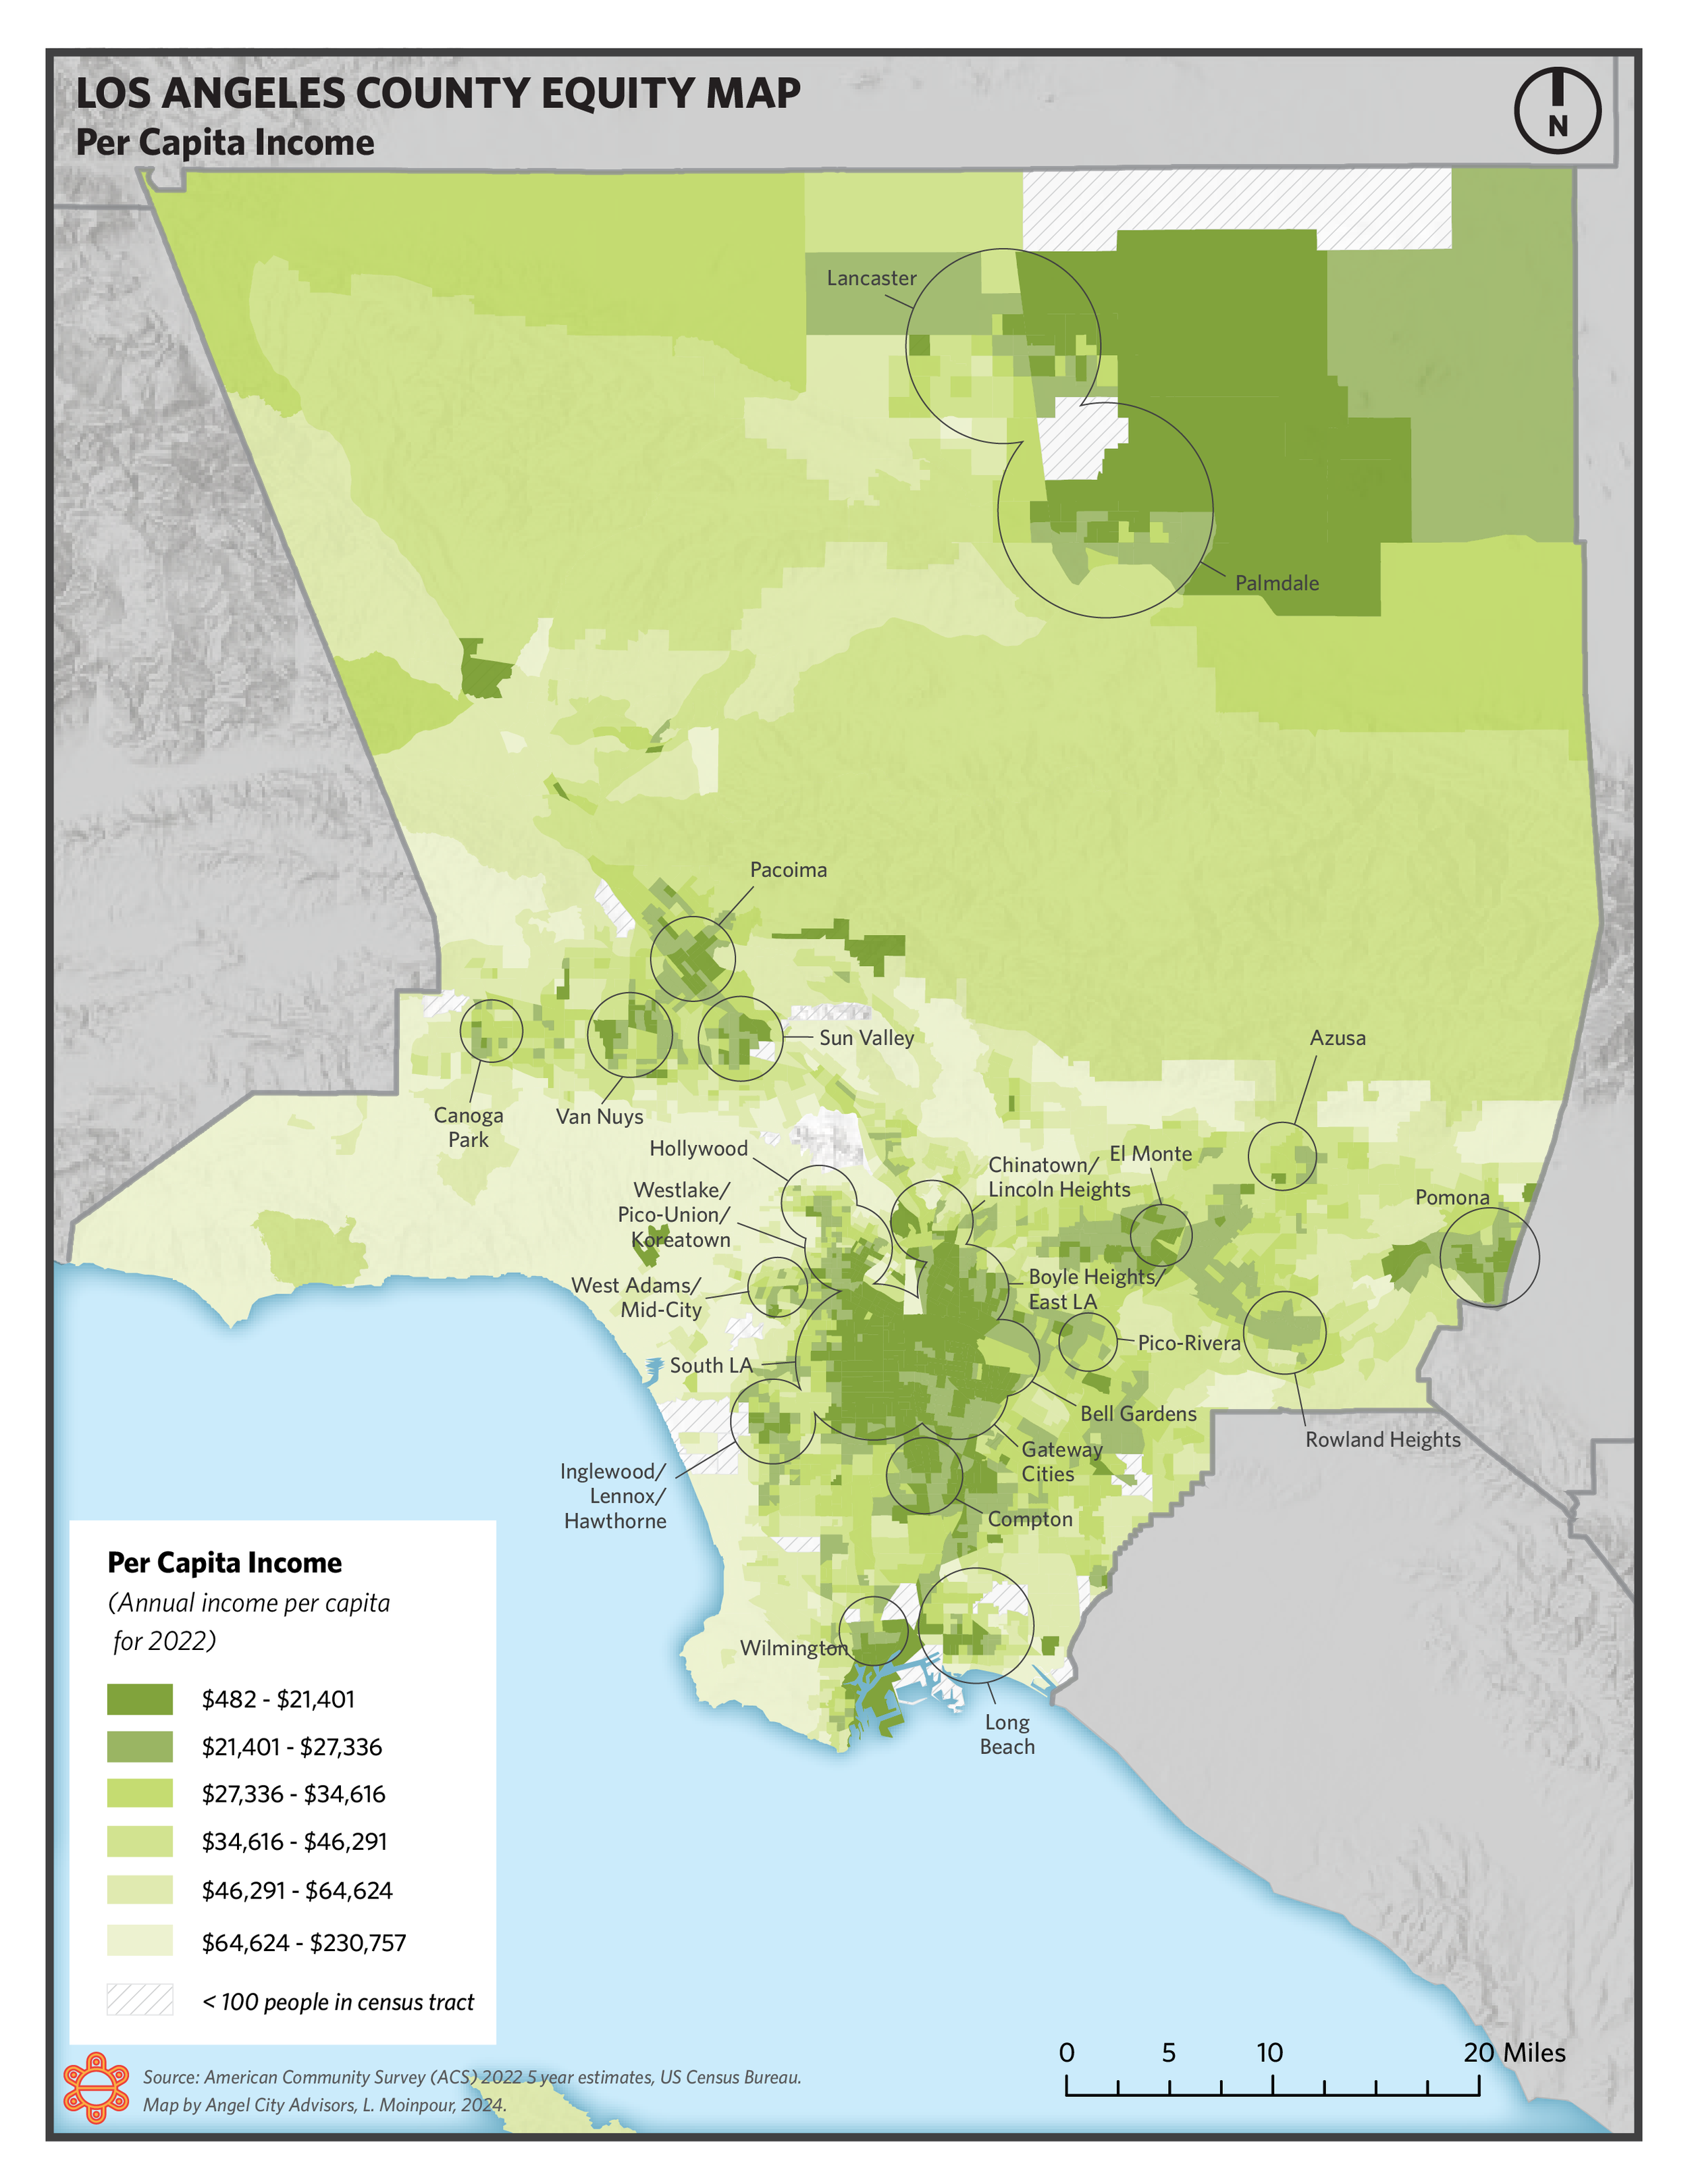
Per Capital Income

Per Capita Income, zoom-in

Income Density

Income Density, zoom-in

Educational Attainment

Educational Attainment, zoom-in

Unemployment

Unemployment, zoom-in

Overcrowding

Overcrowding, zoom-in

Homeless Population

Homeless Population, zoom-in

Homeless Population Density

Homeless Population Density, zoom-in

Combined Public Benefits: Case Count
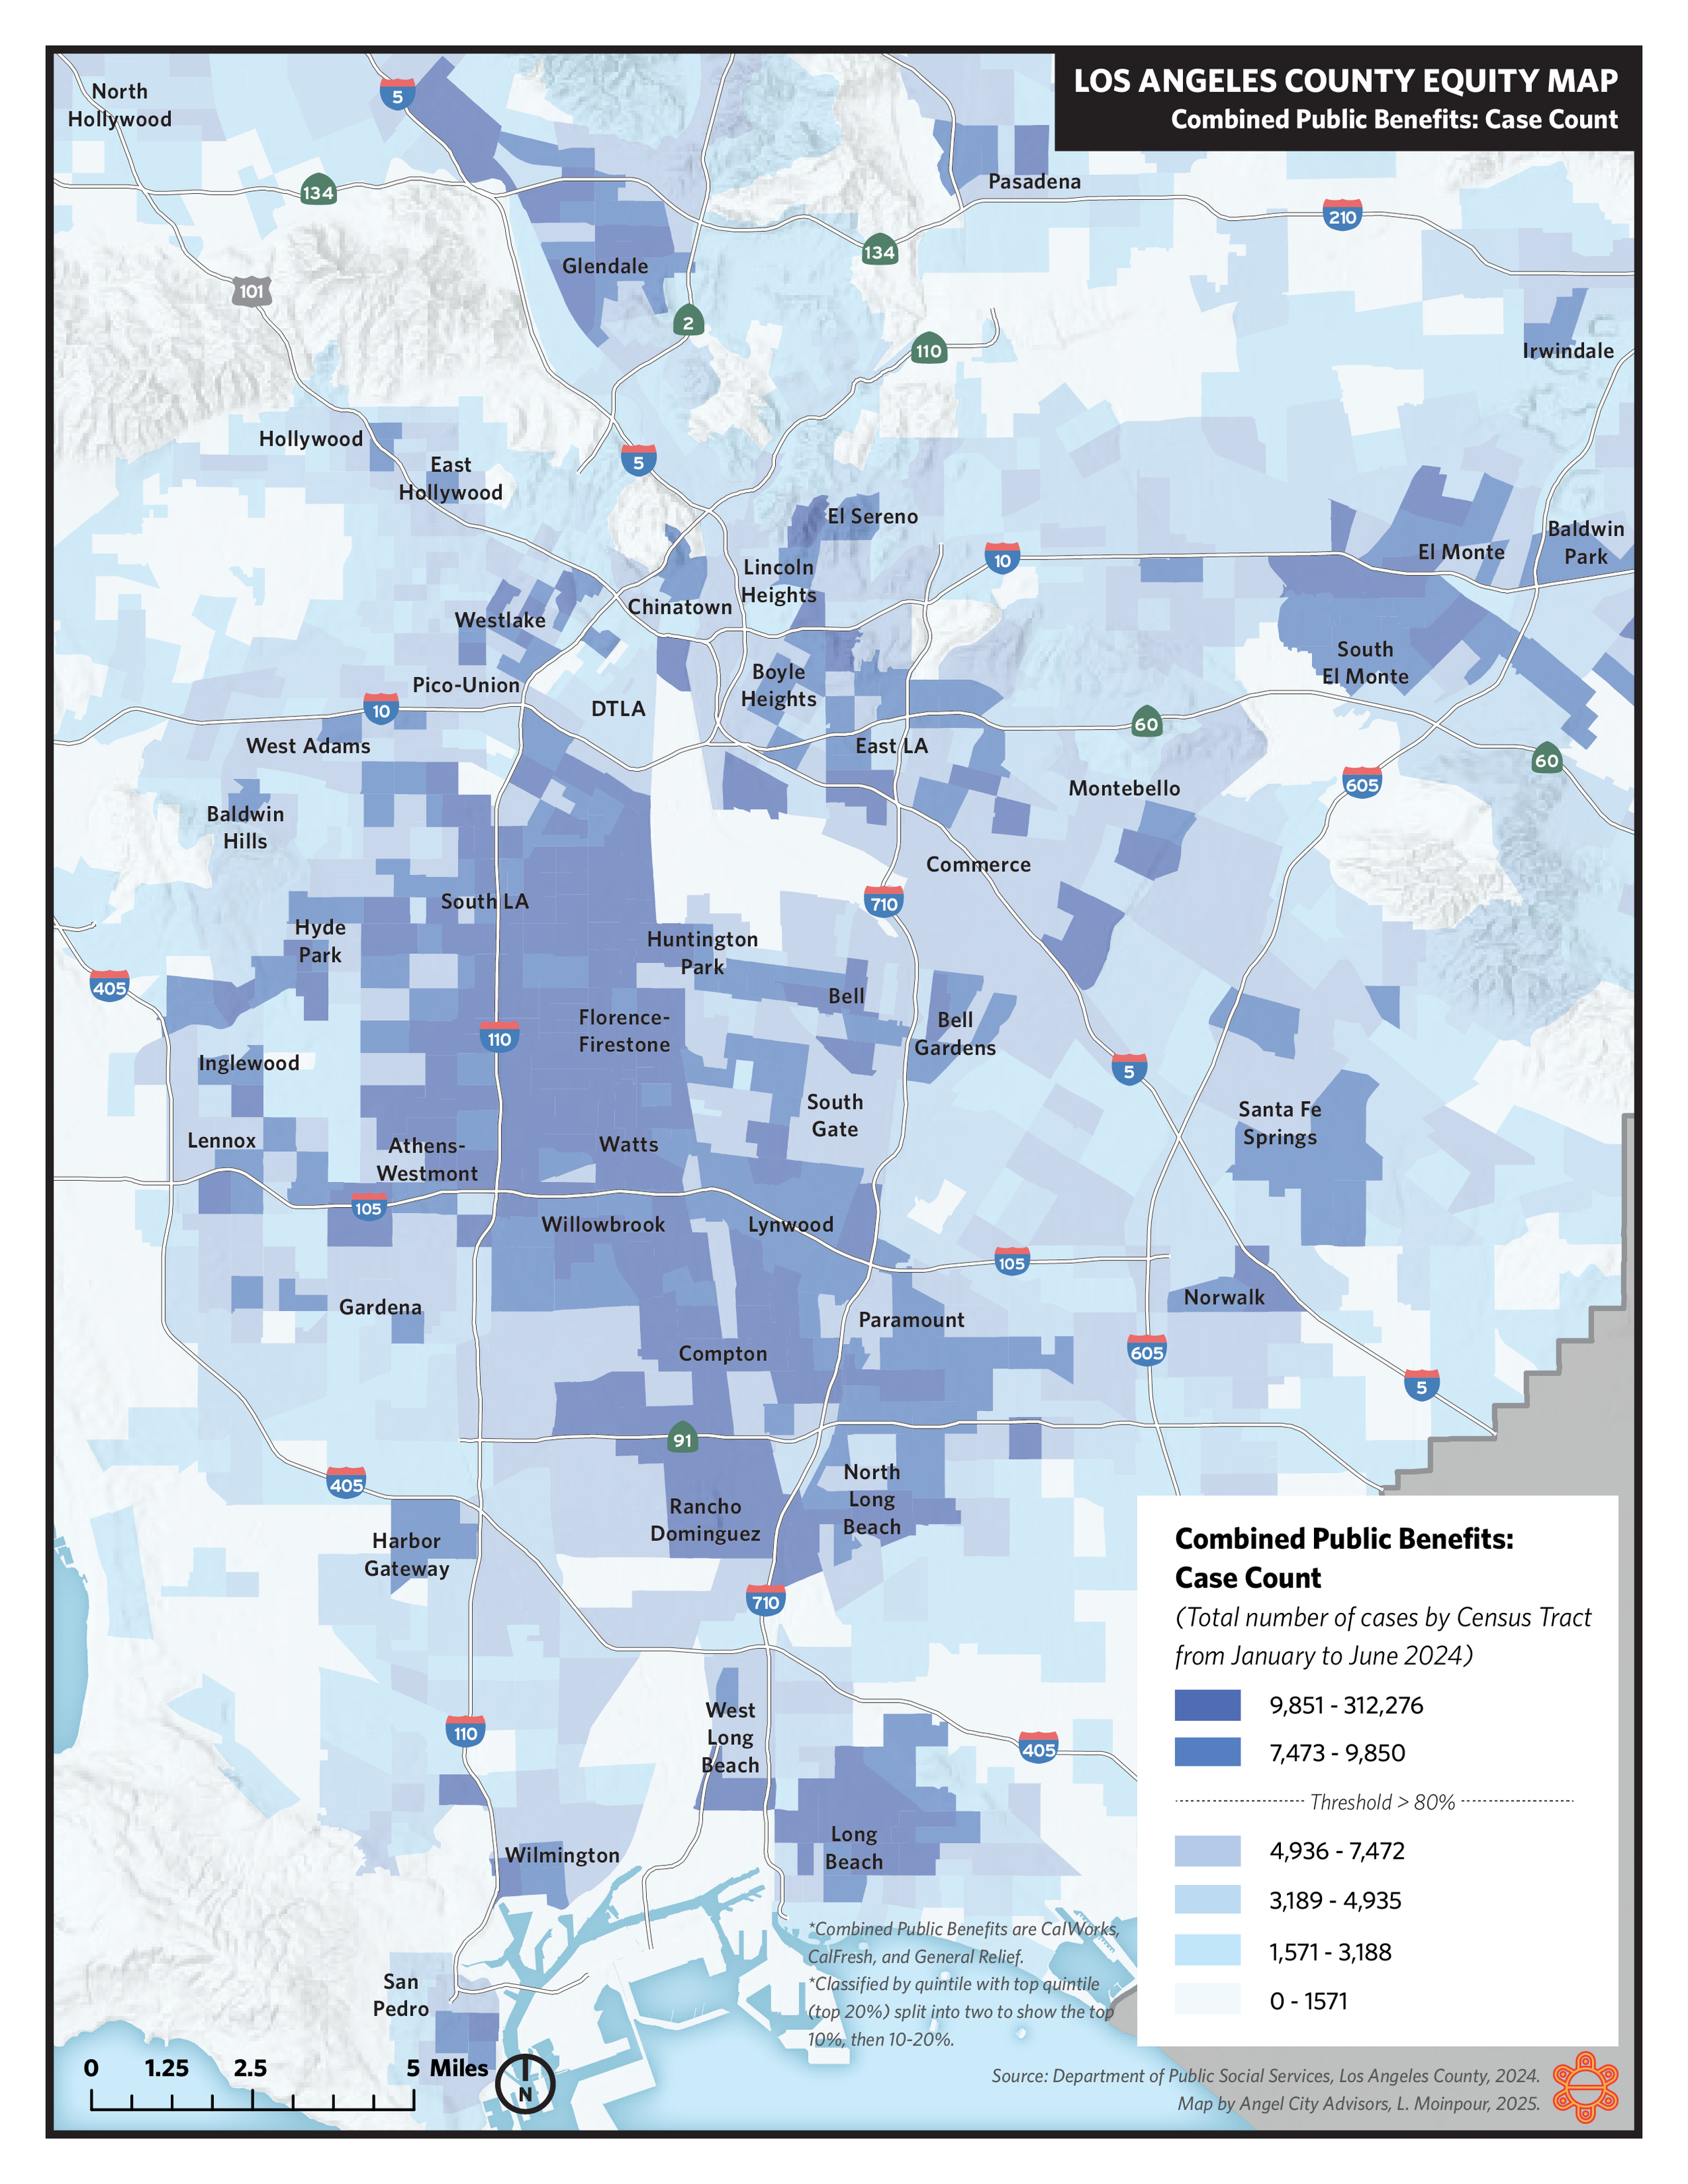
Combined Public Benefits: Case Count, zoom-in

Combined Public Benefits: Case Density
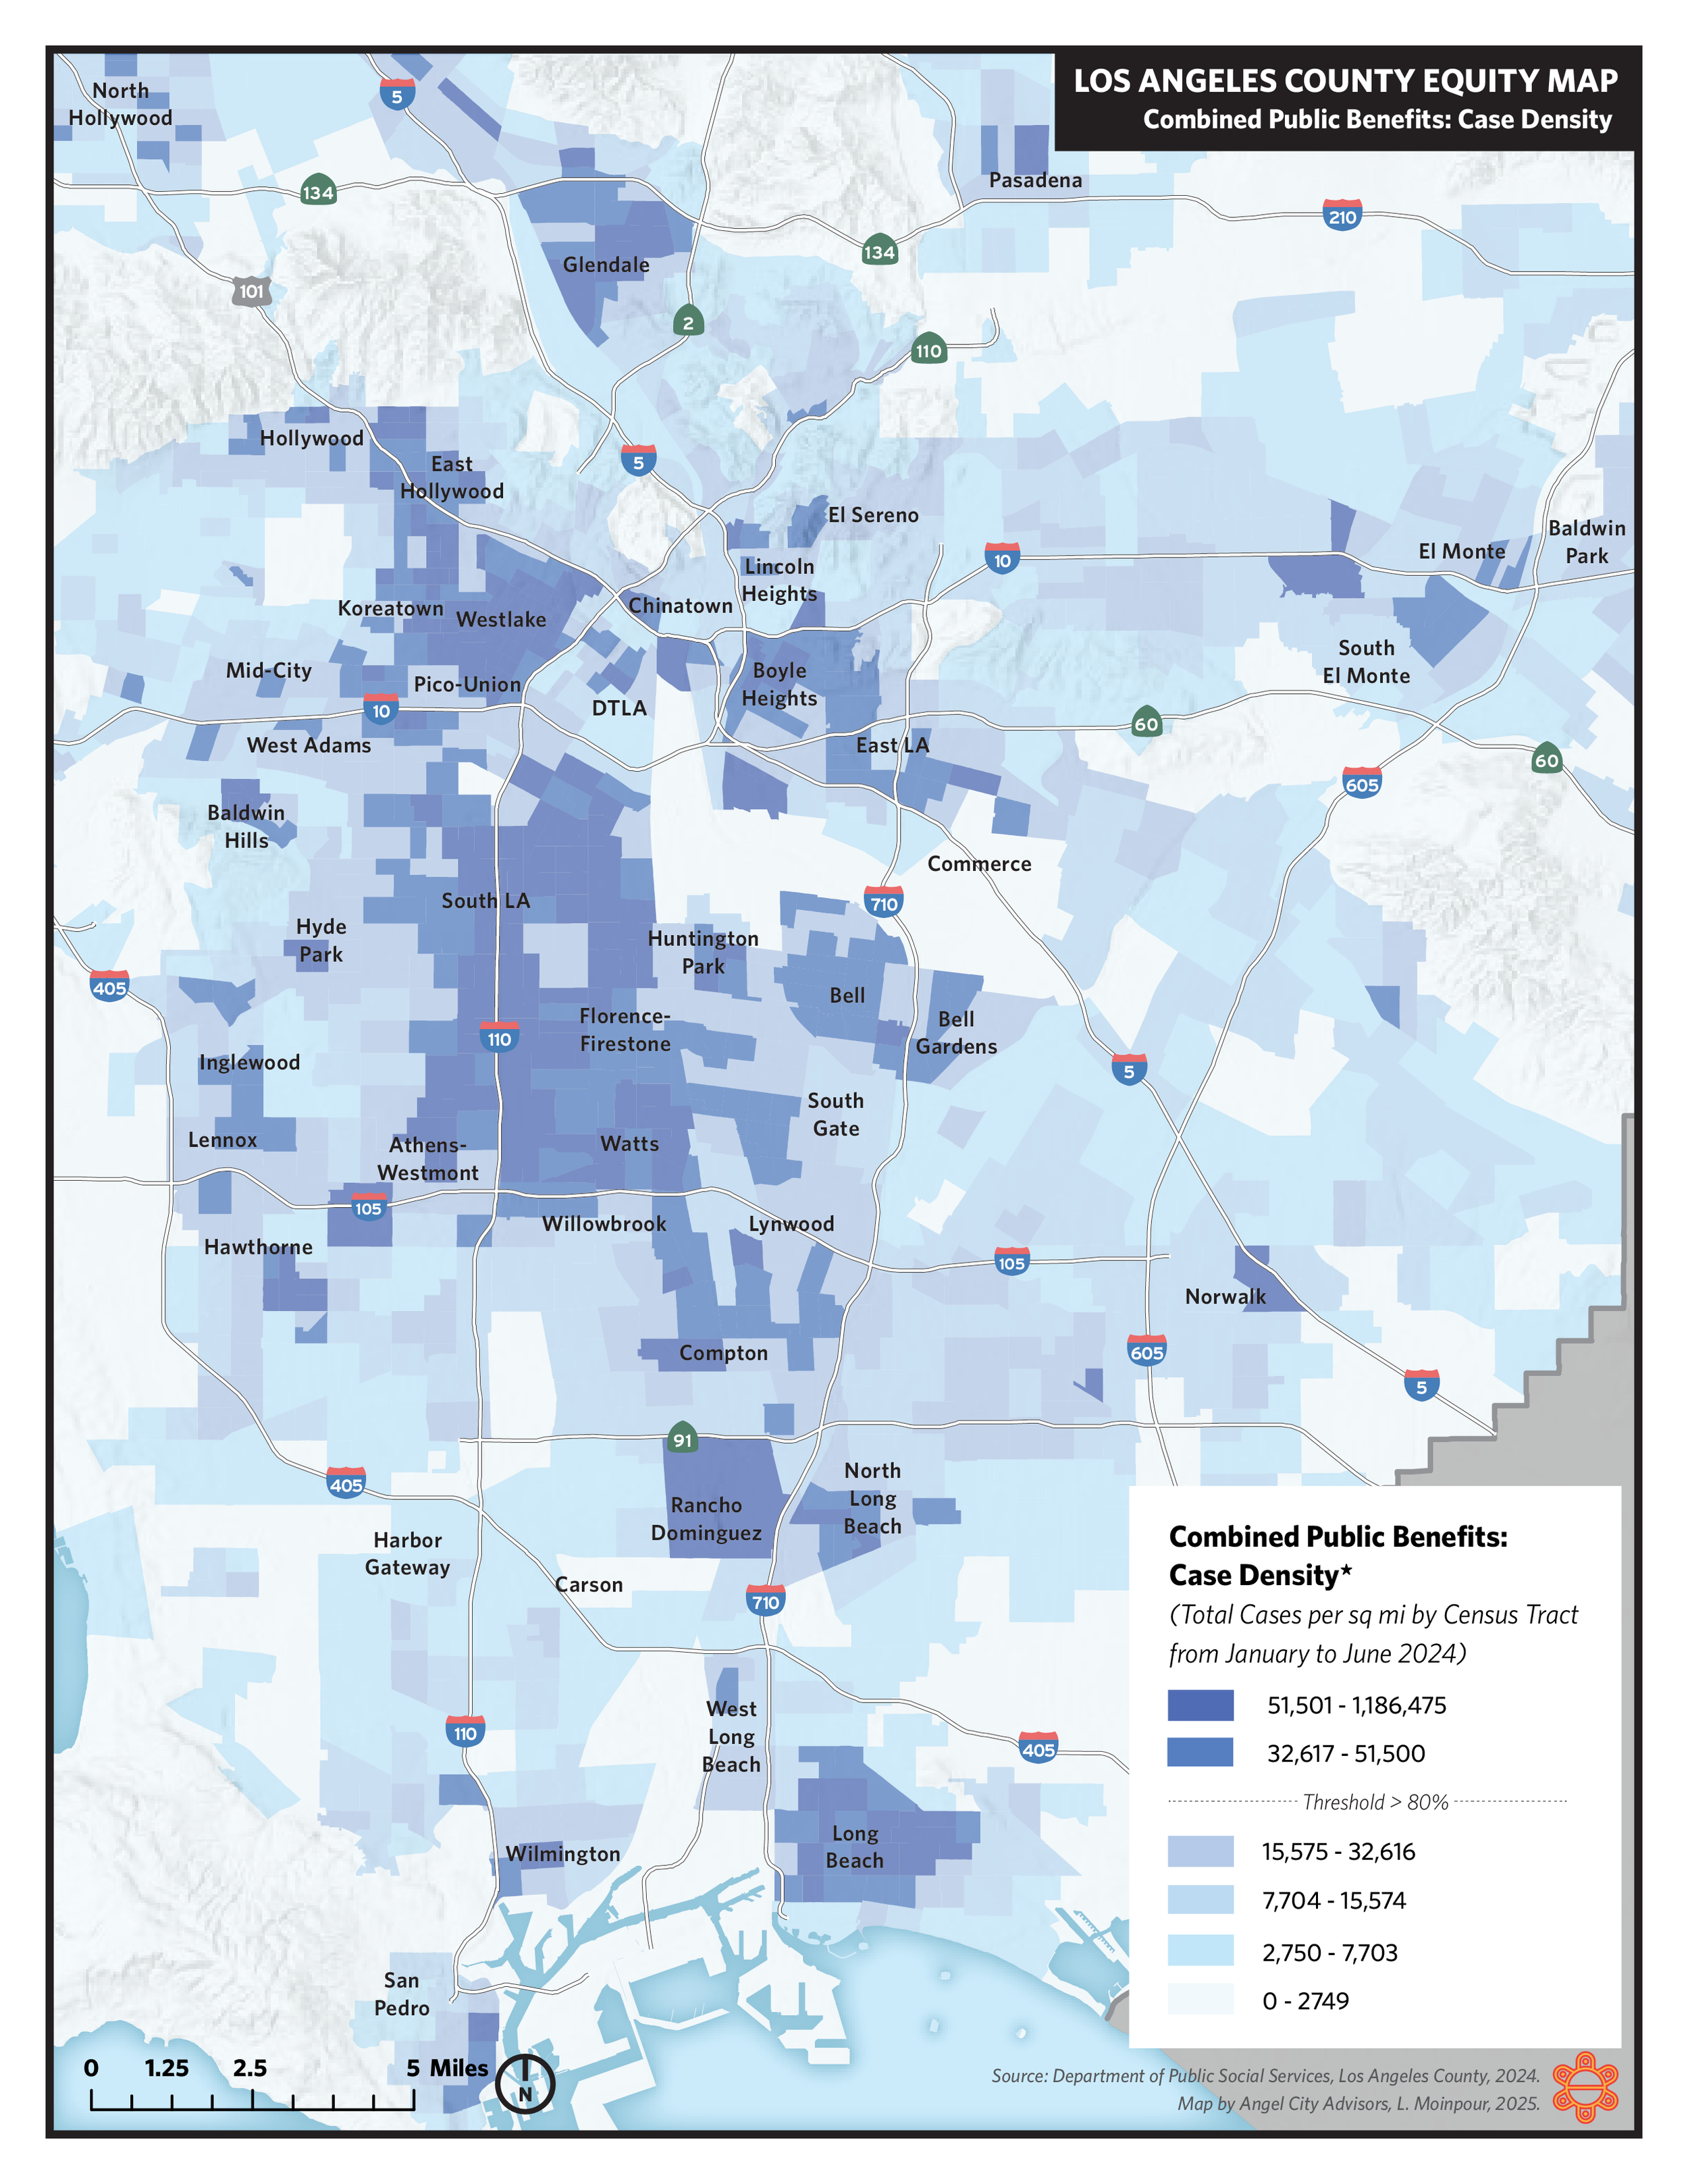
Combined Public Benefits: Case Density, zoom-in
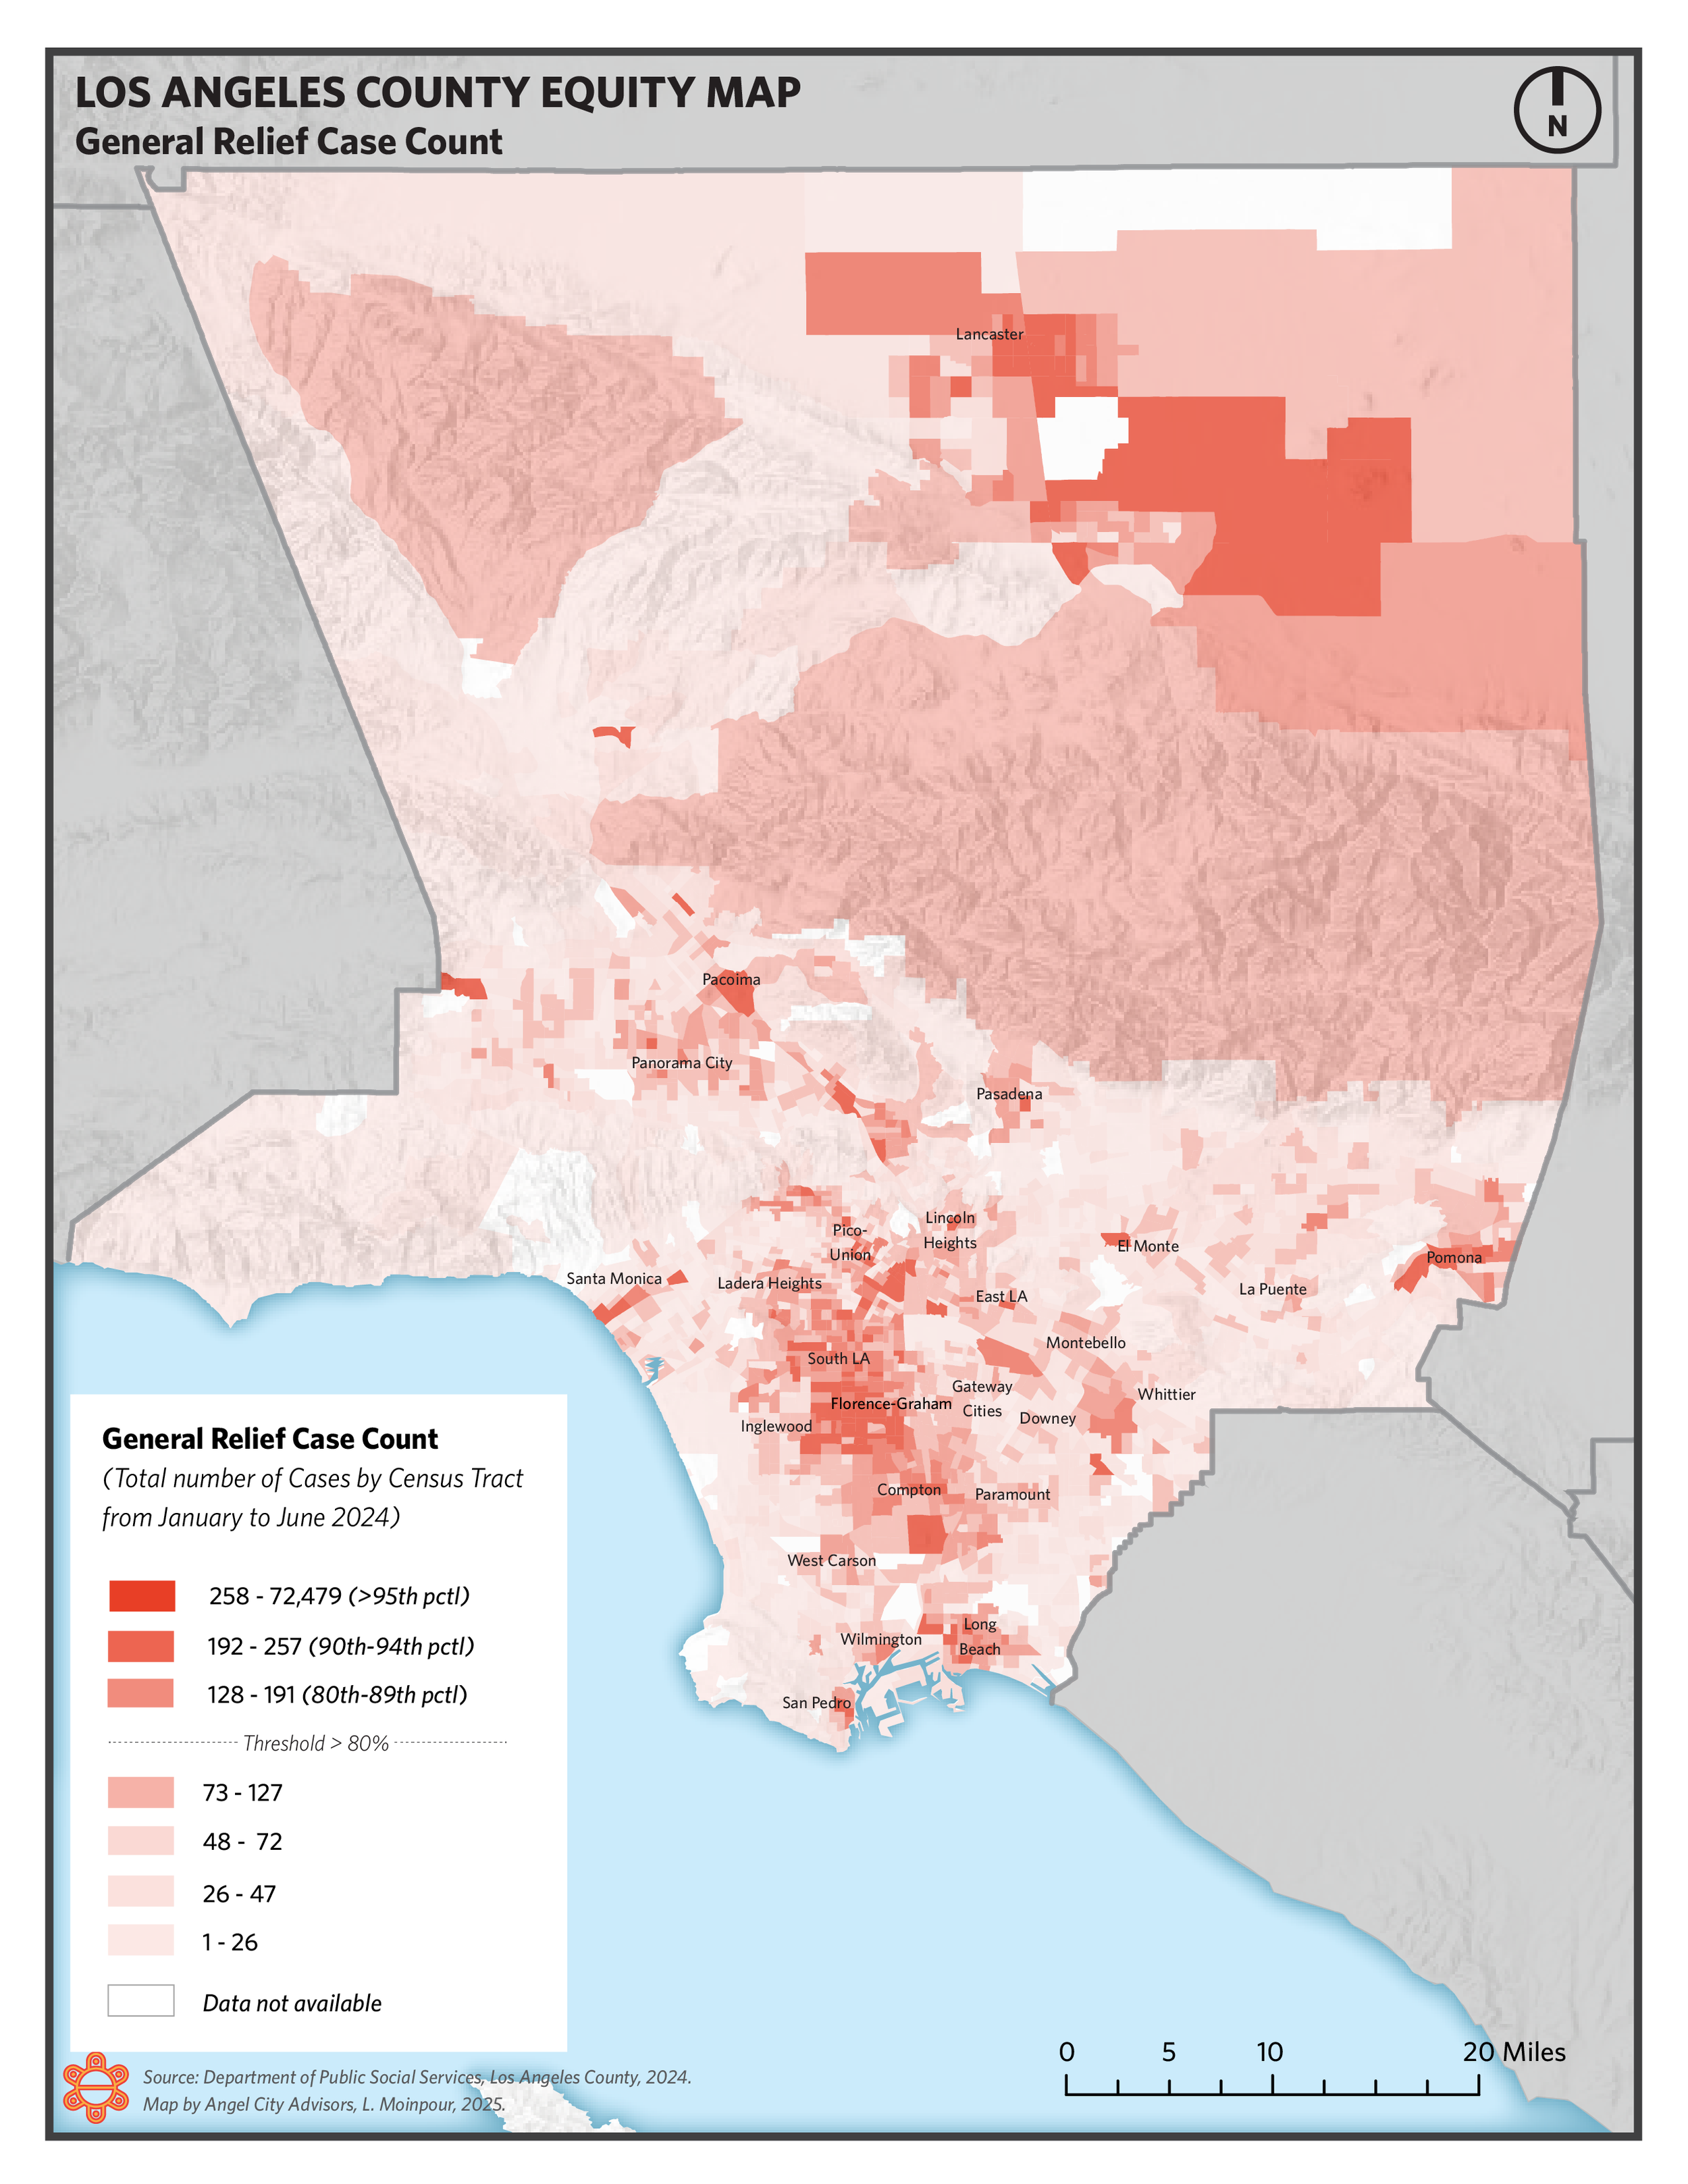
General Relief: Case Count
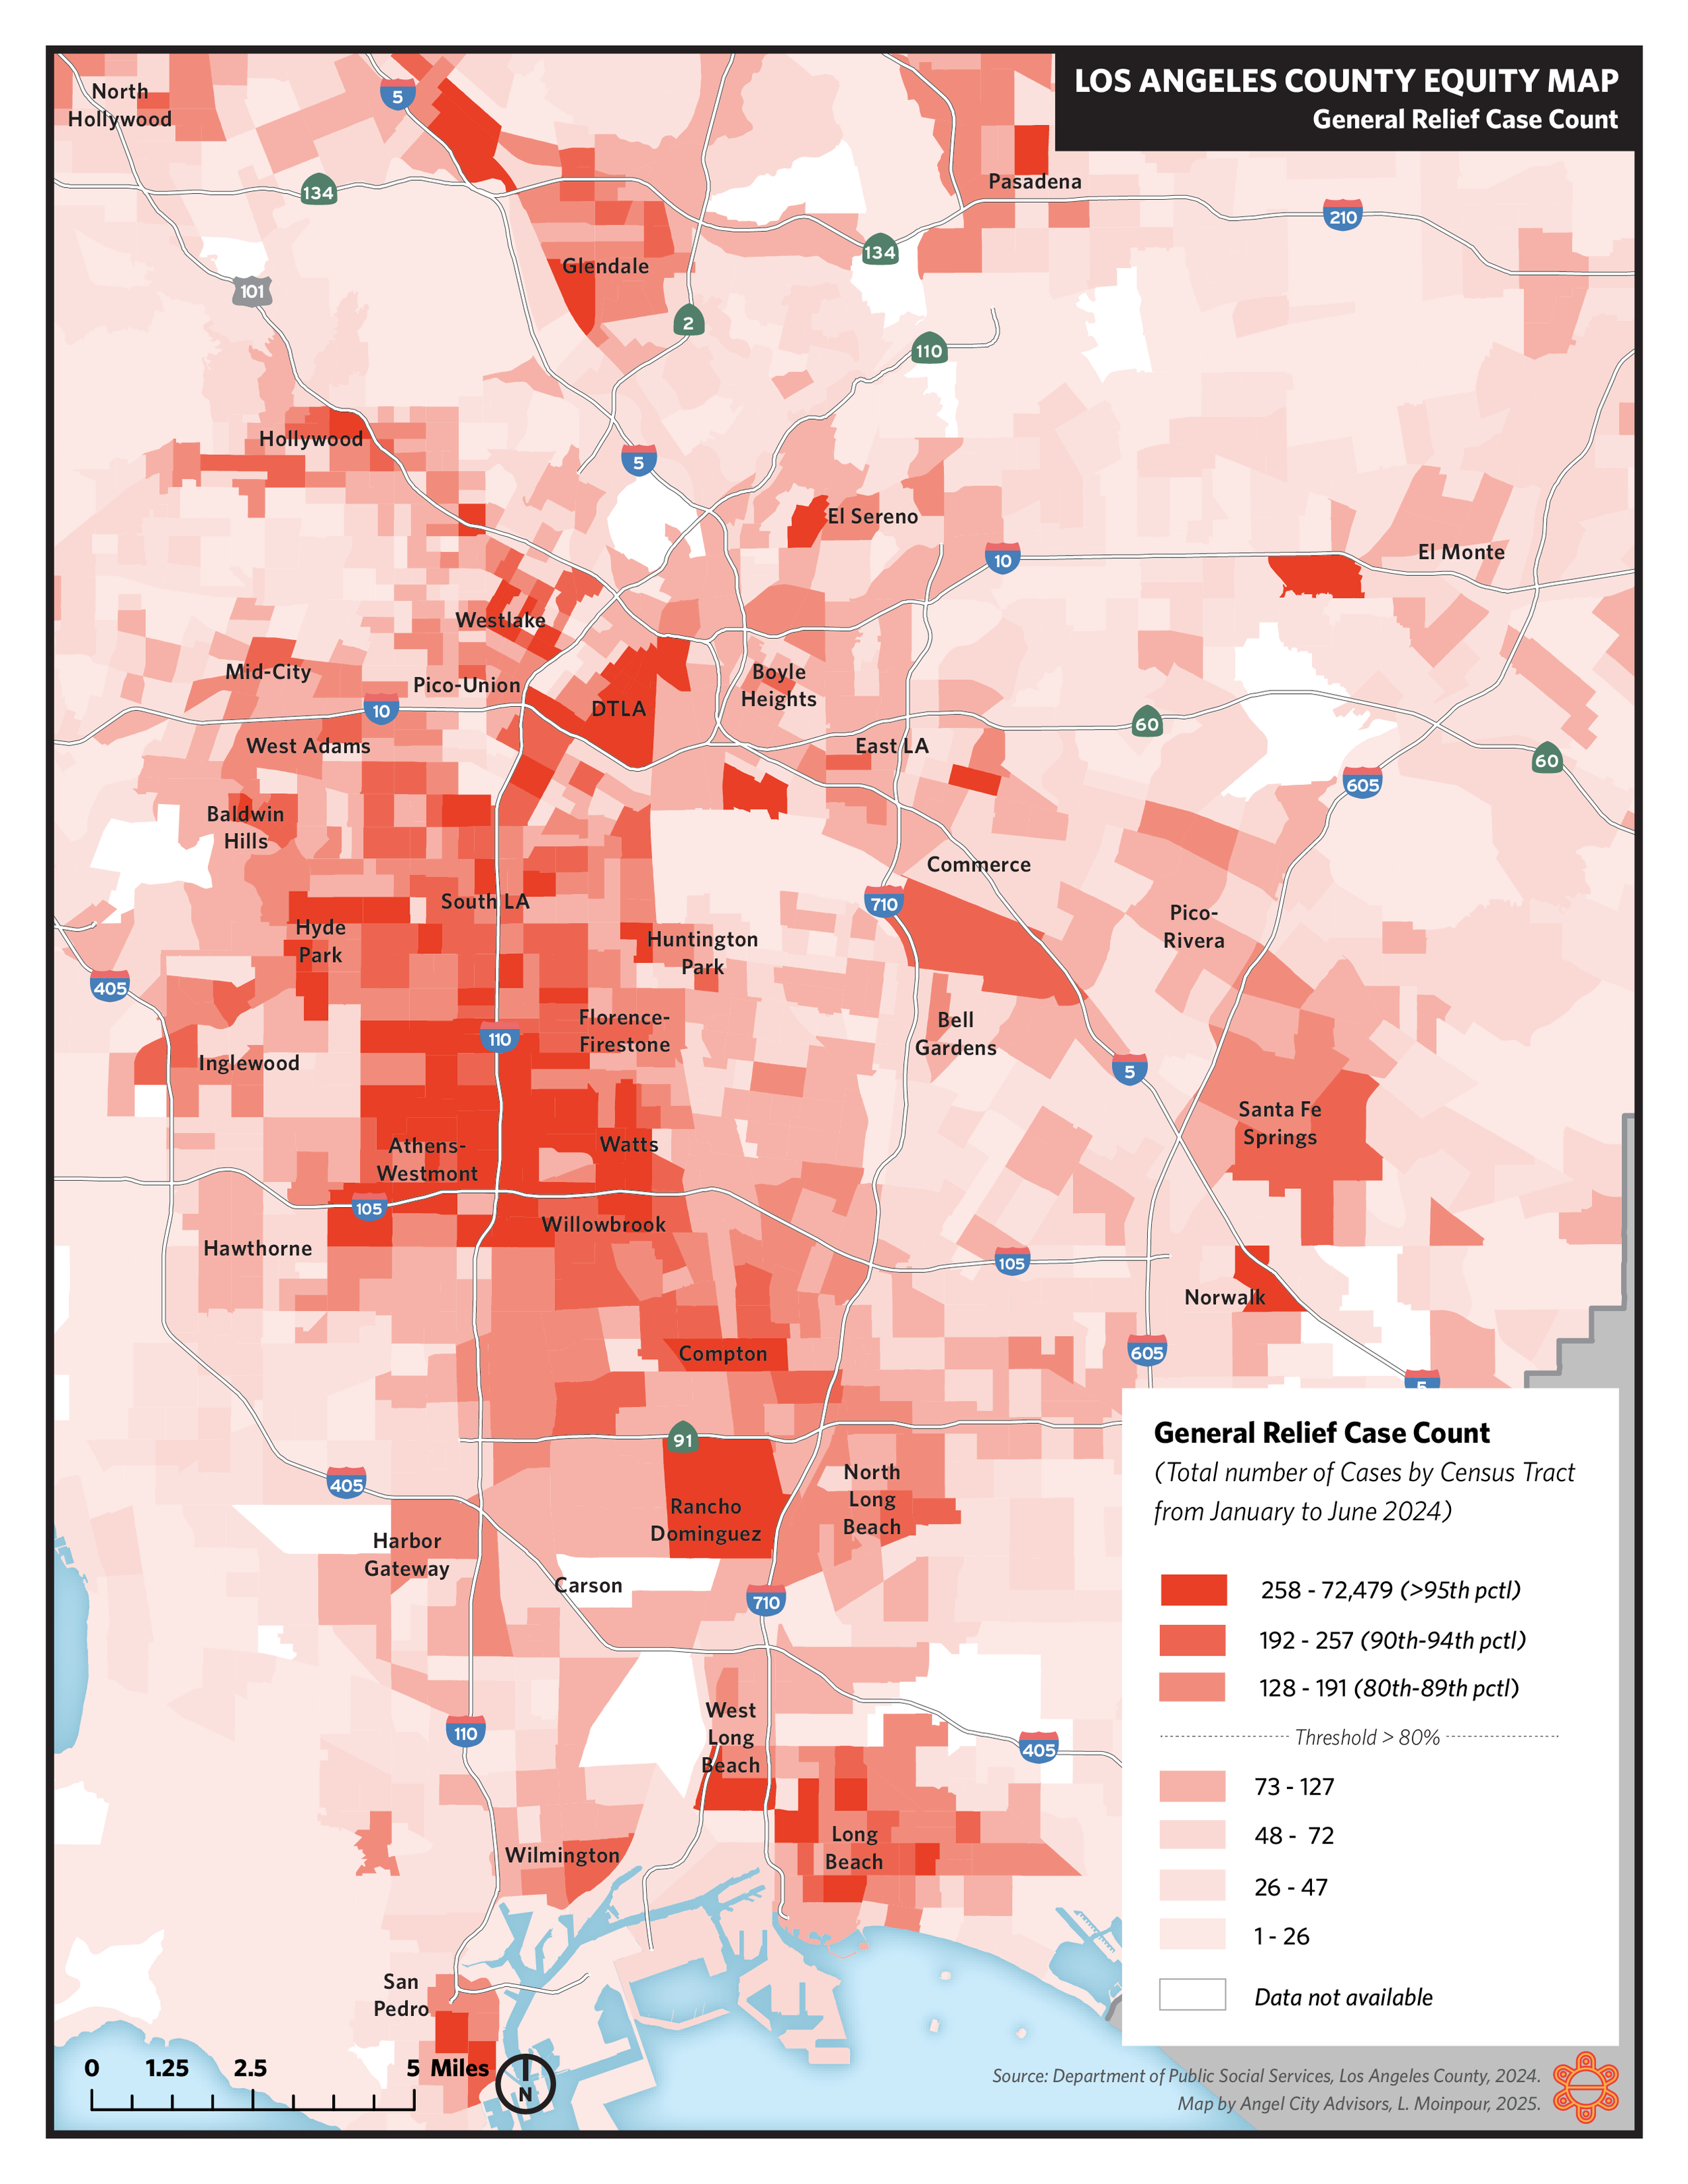
General Relief: Case Count, zoom-in

General Relief: Case Density

General Relief: Case Density, zoom-in
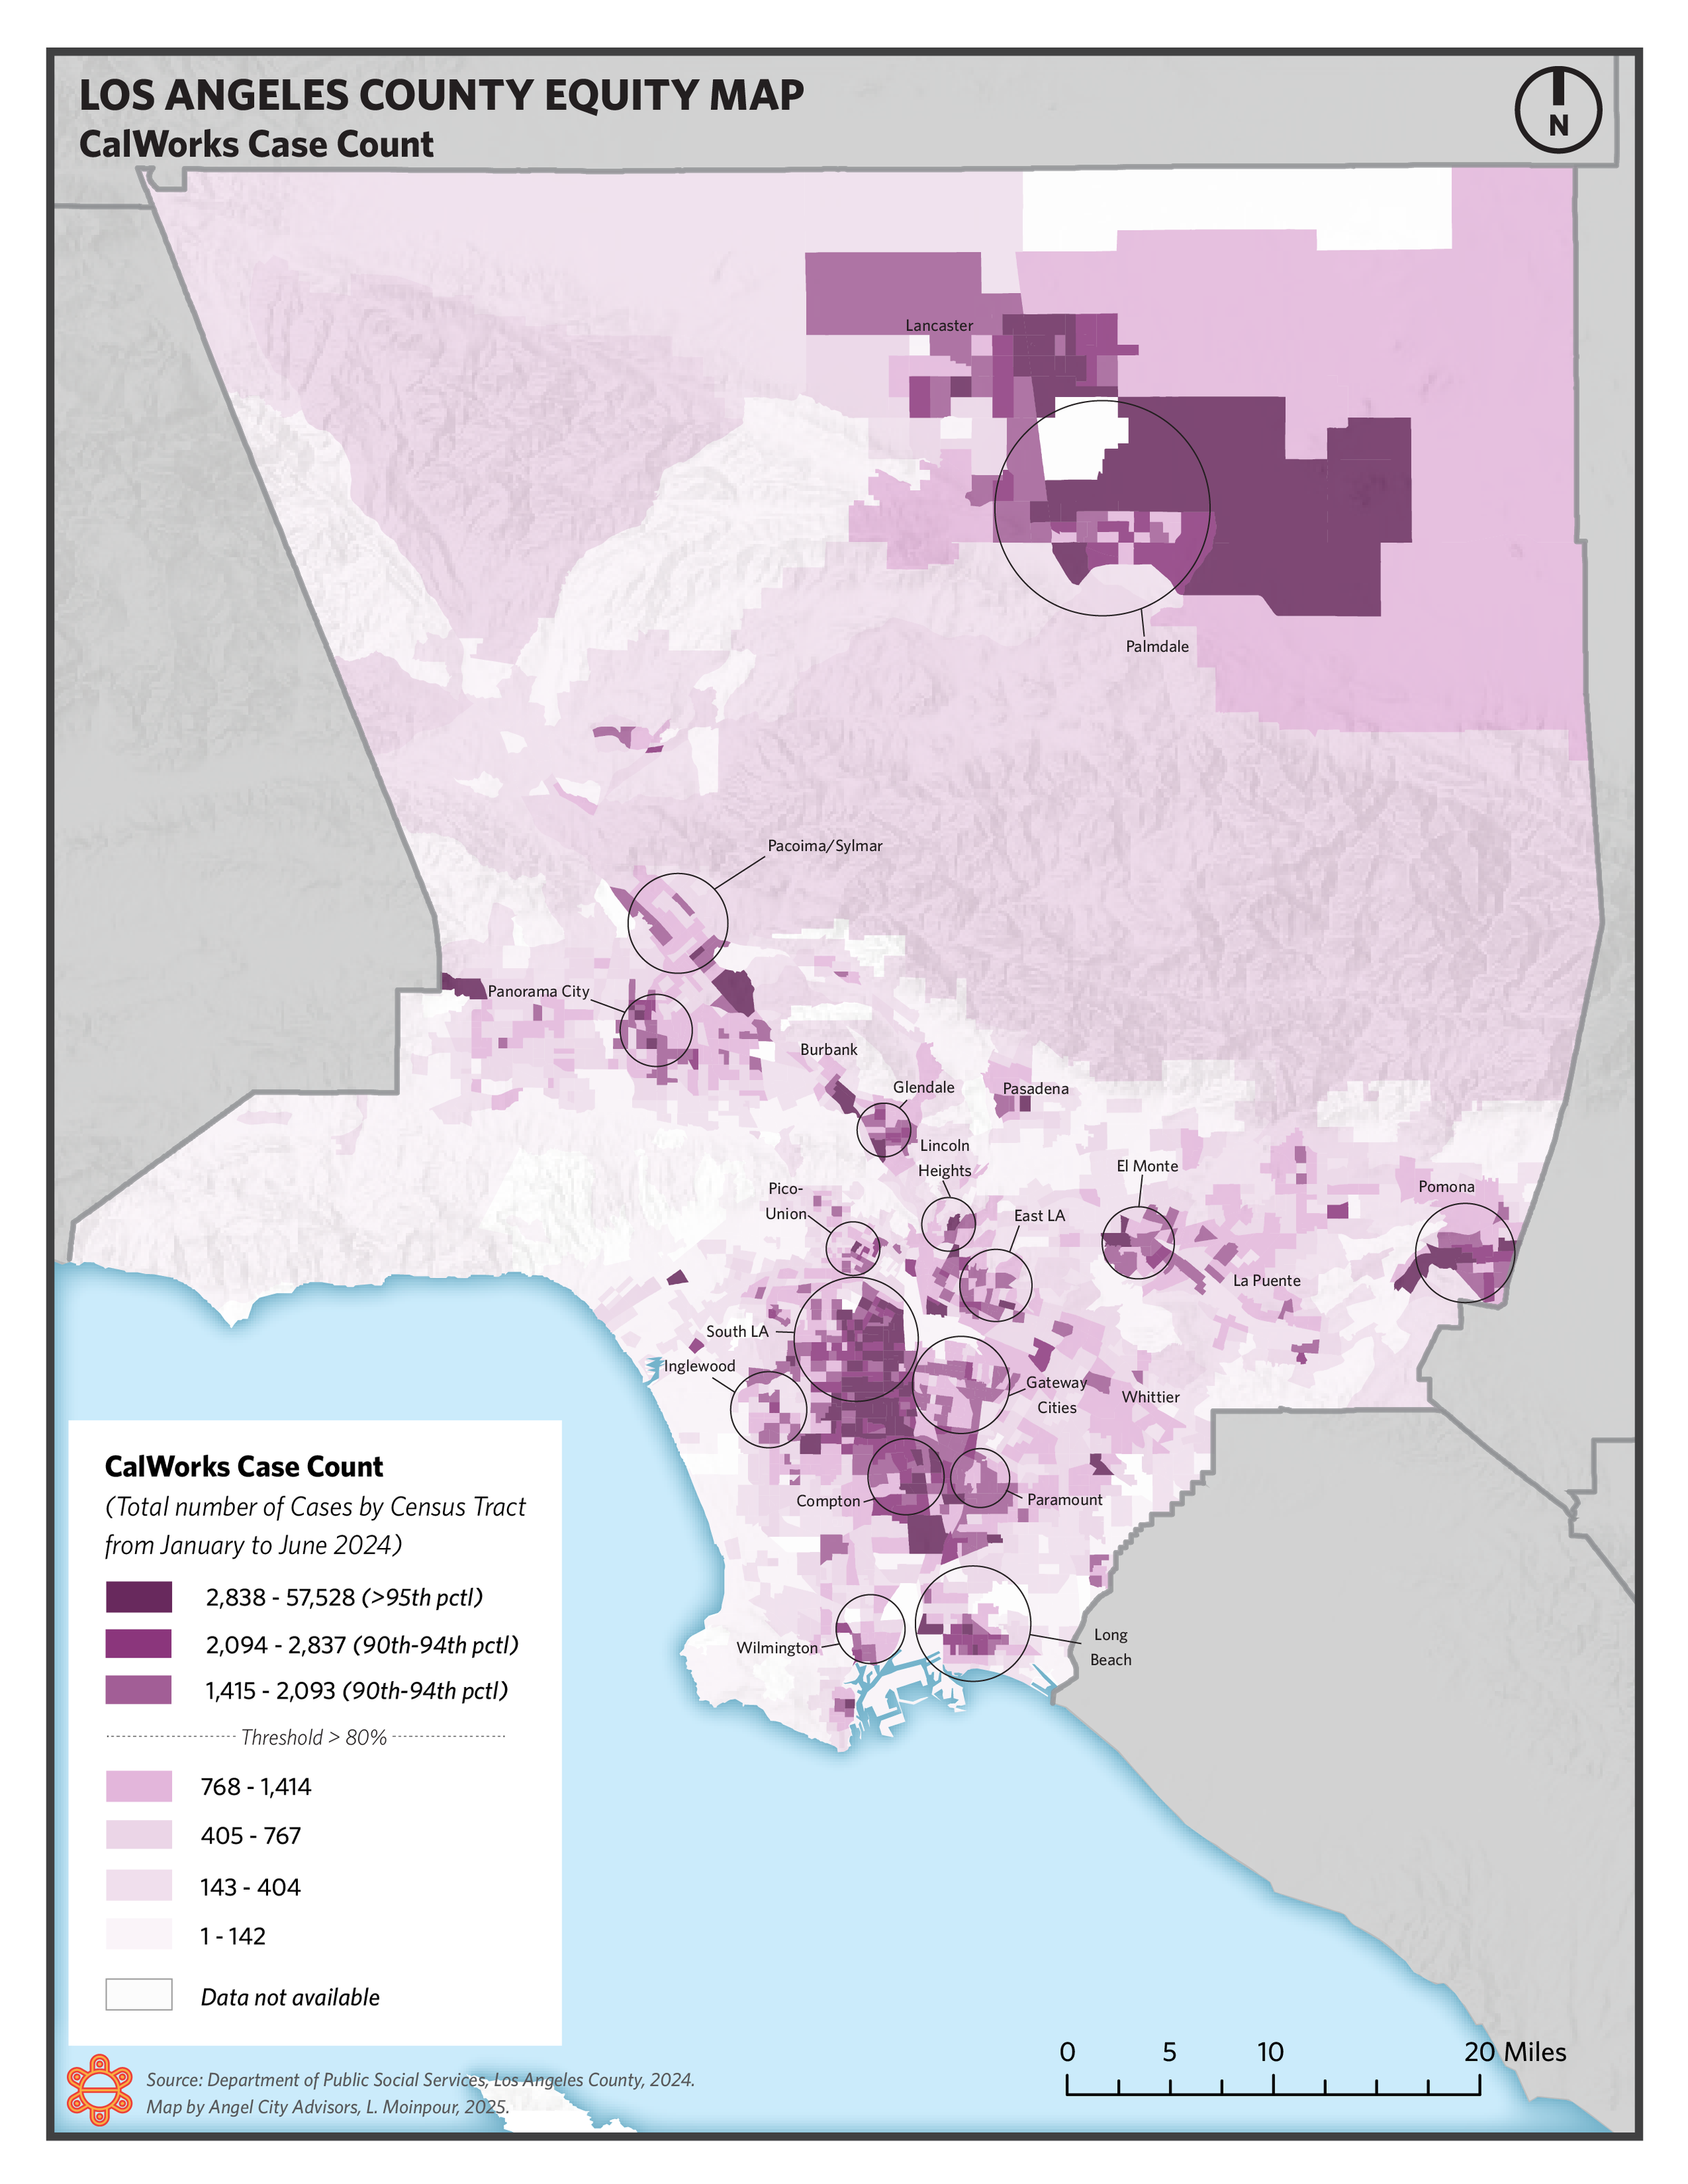
CalWorks: Case Count
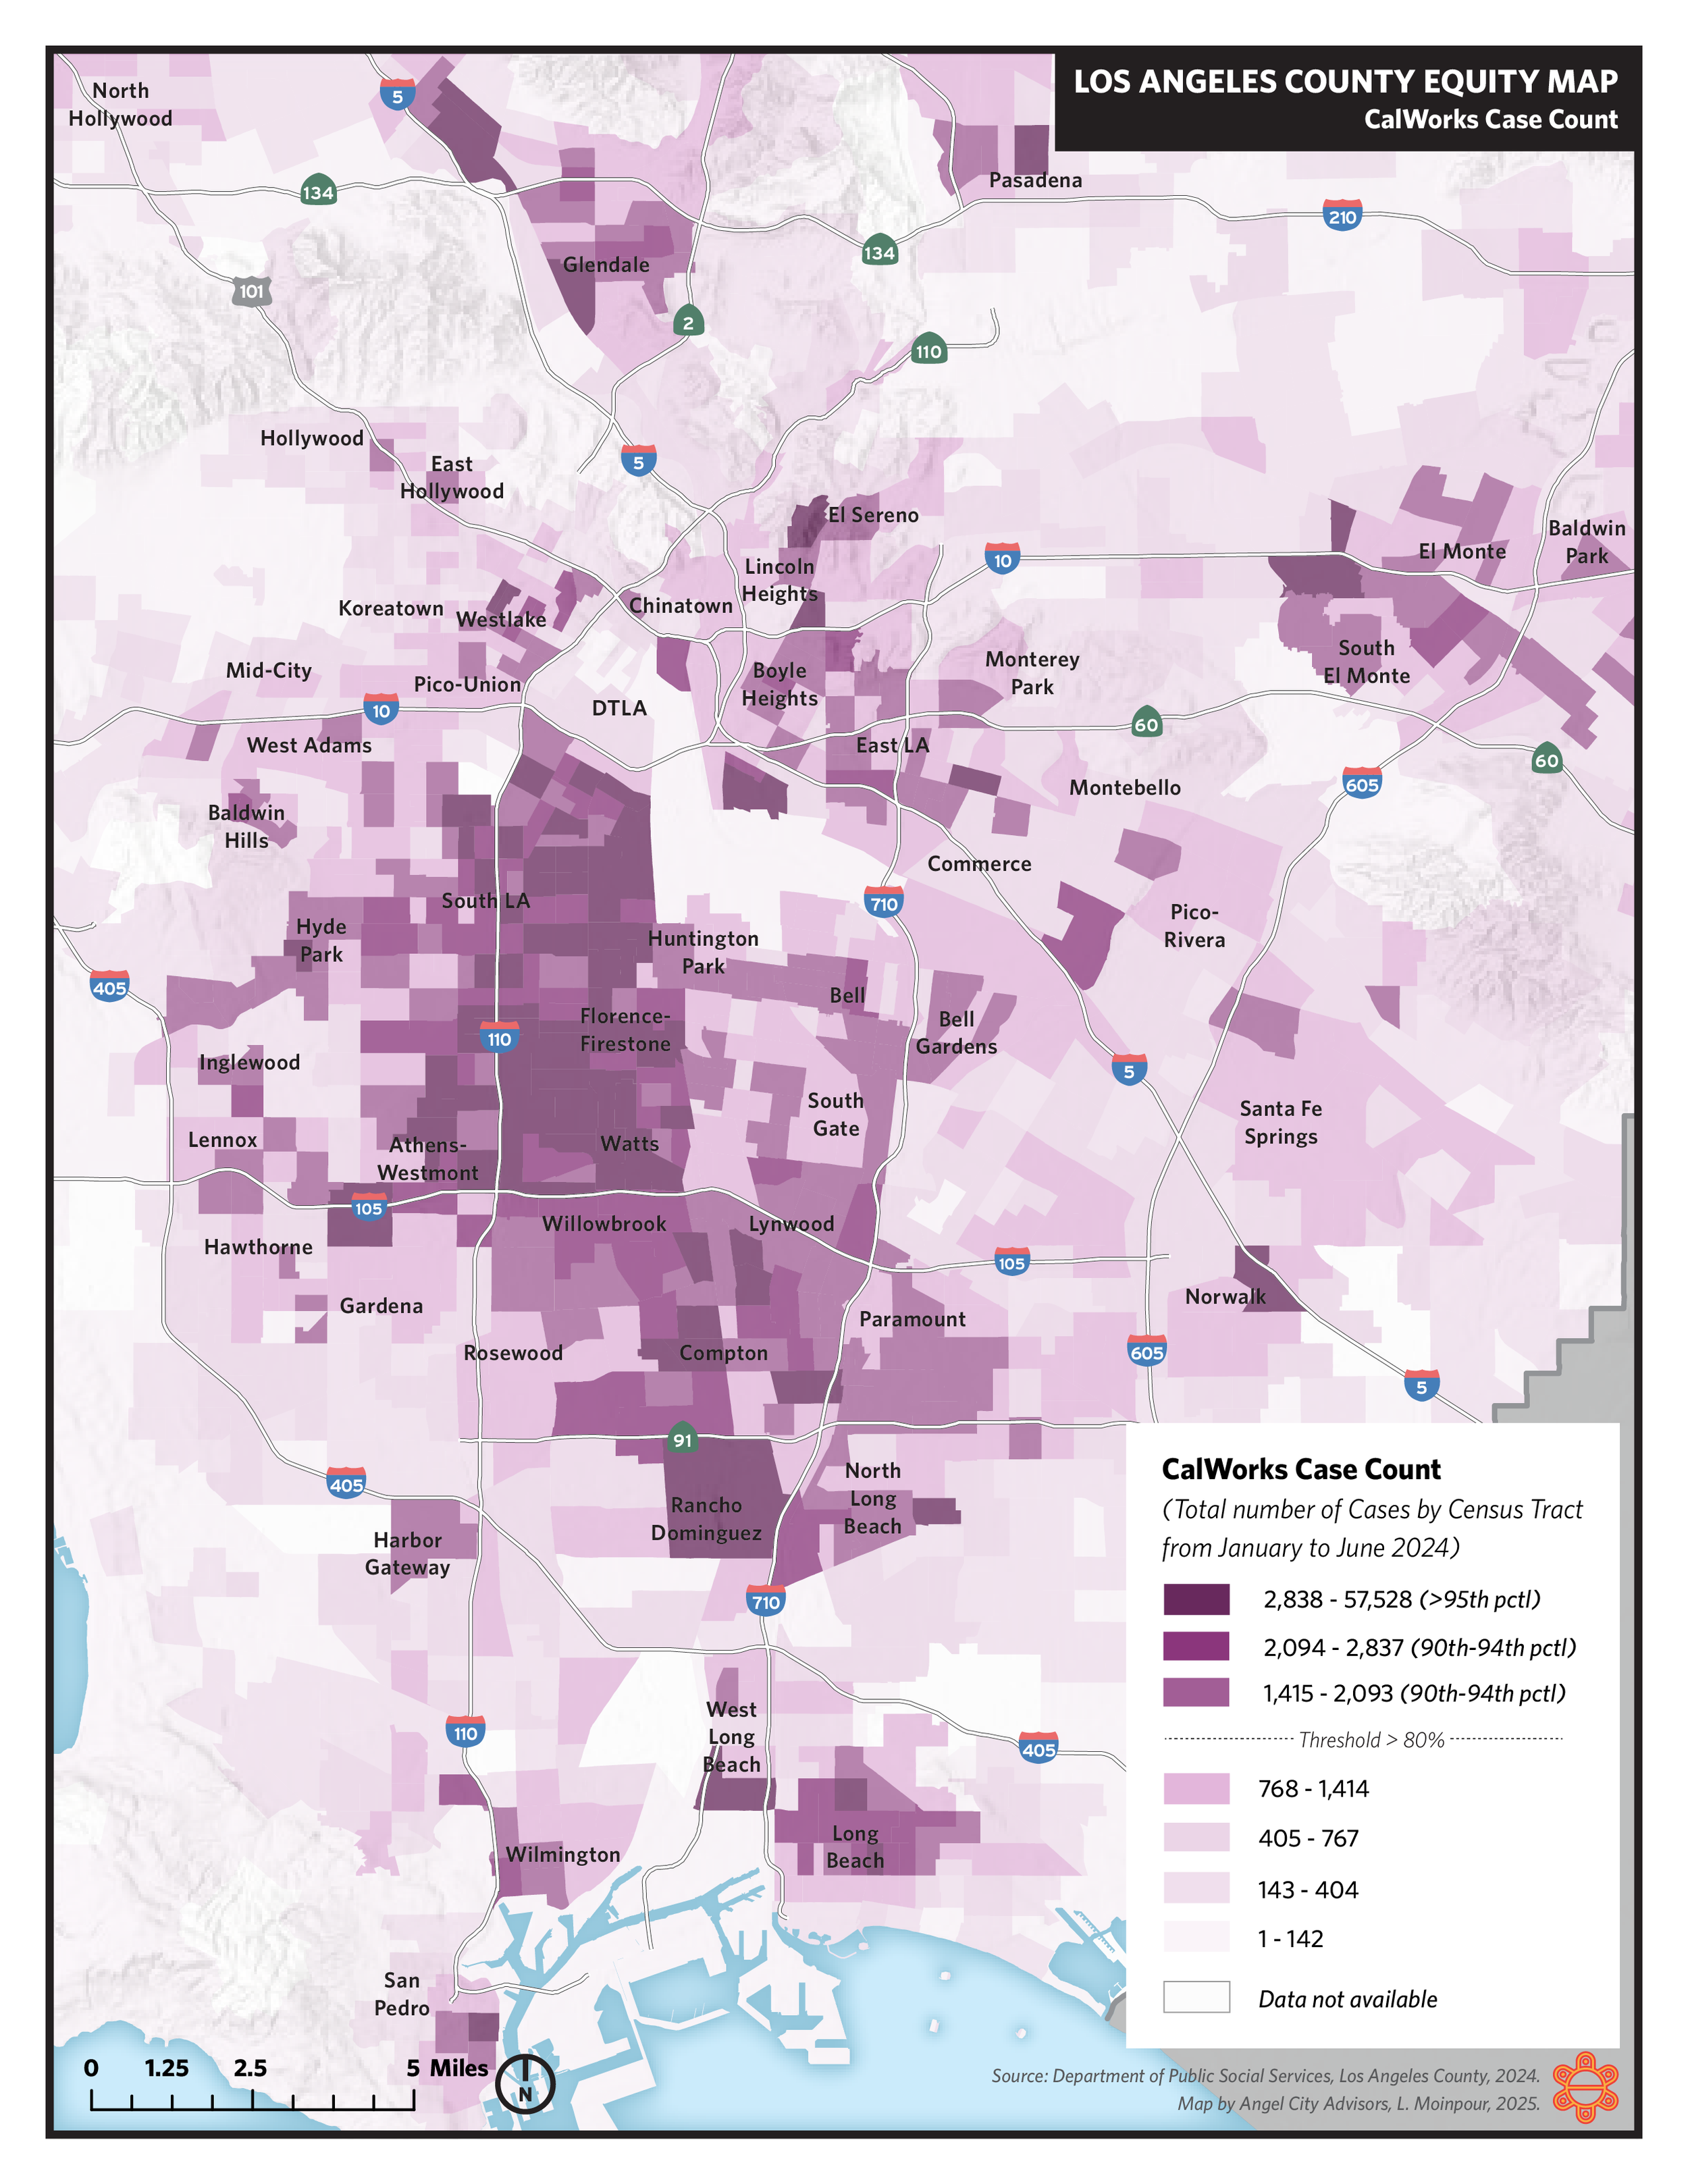
CalWorks: Case Count, zoom-in
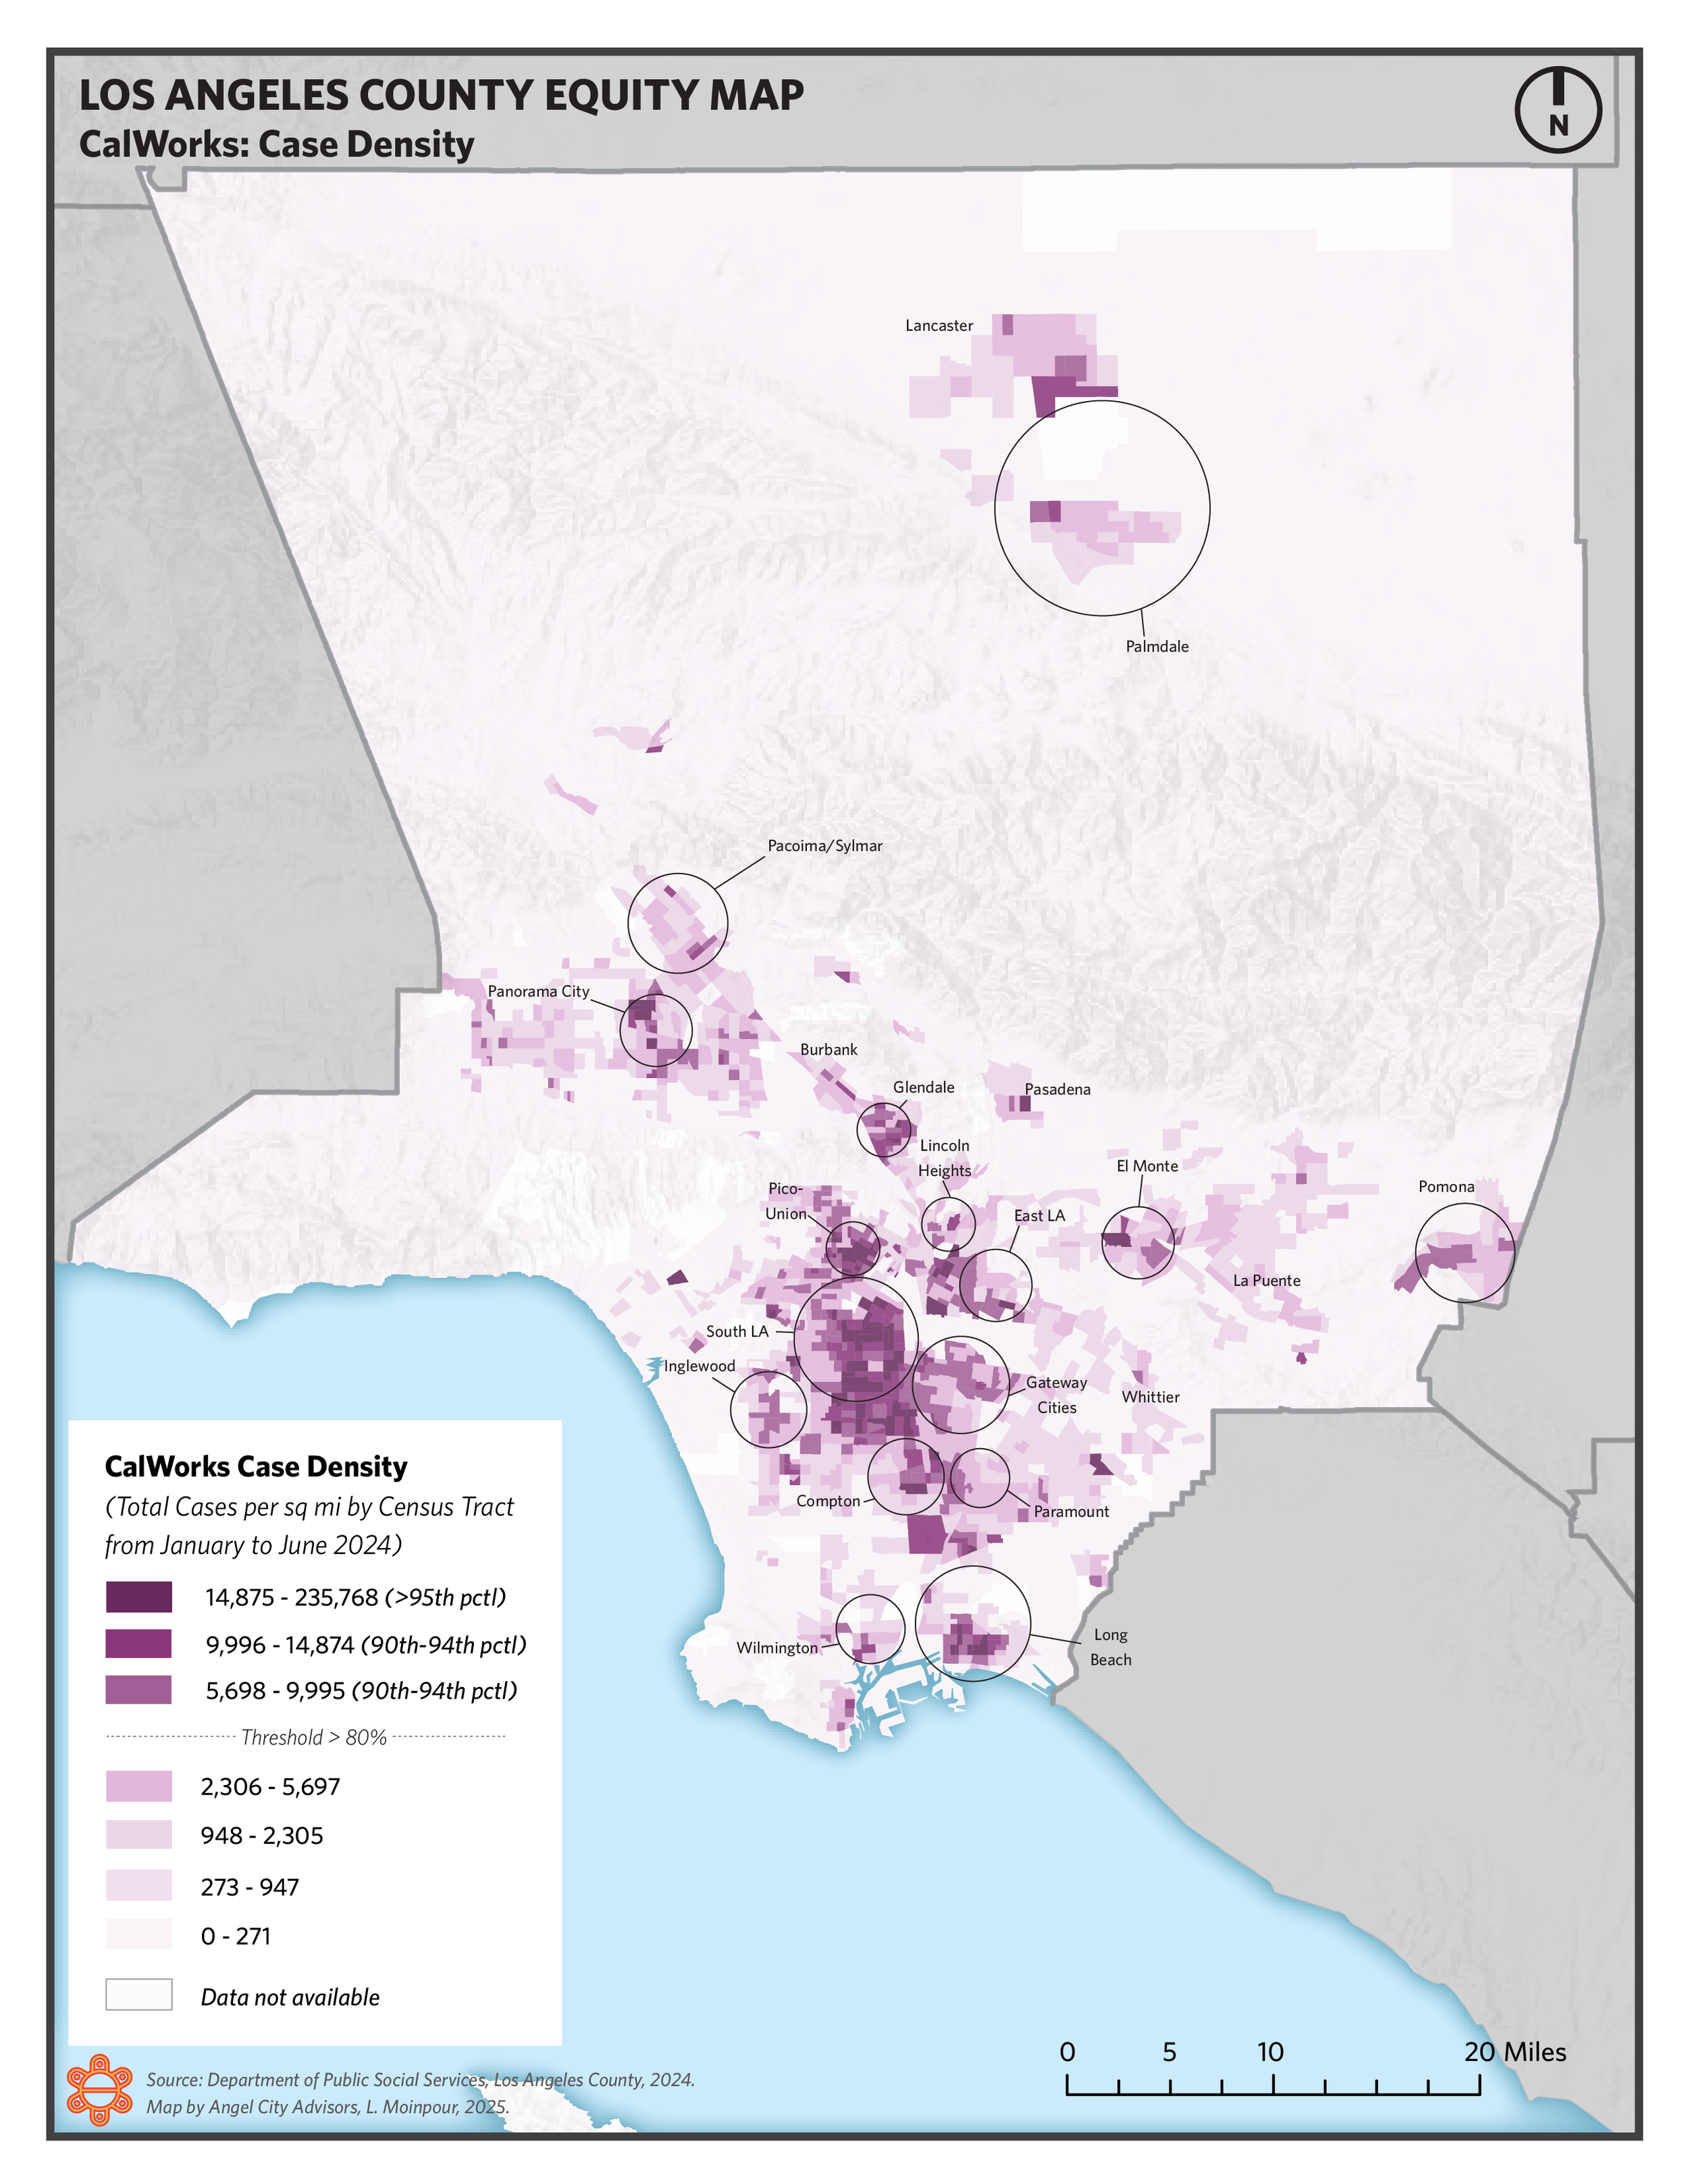
CalWorks: Case Density
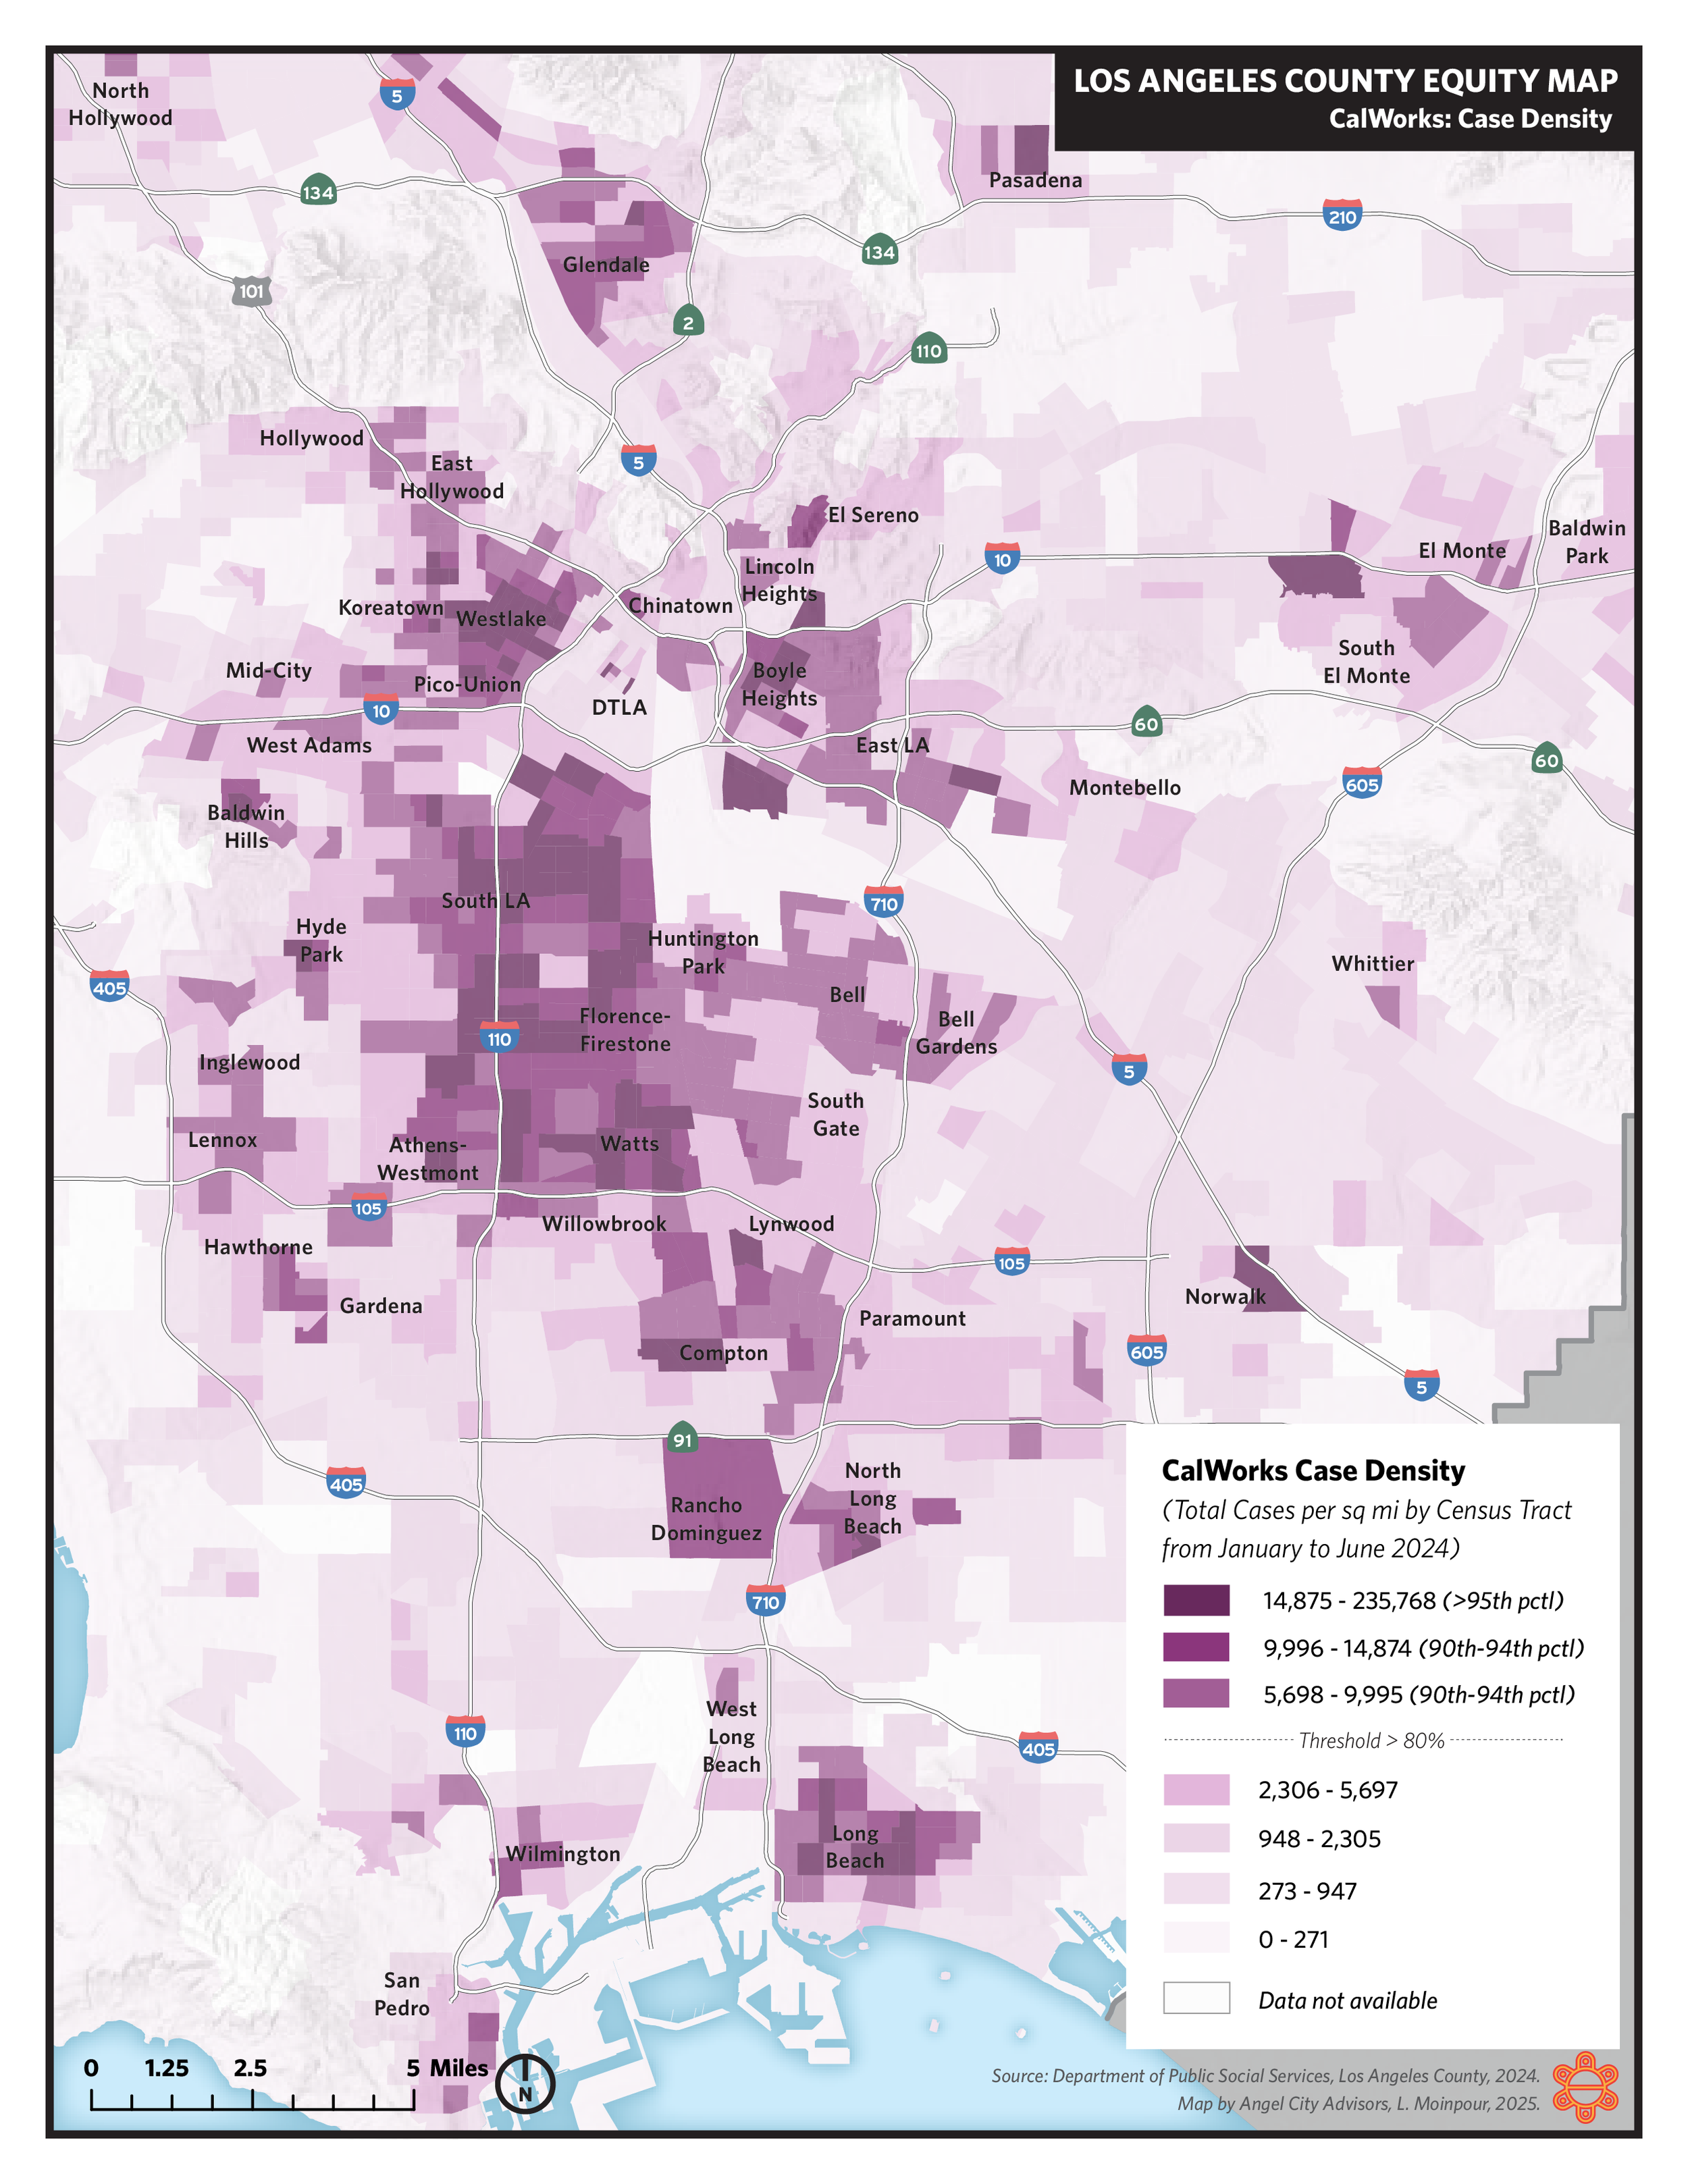
CalWorks: Case Density, zoom-in
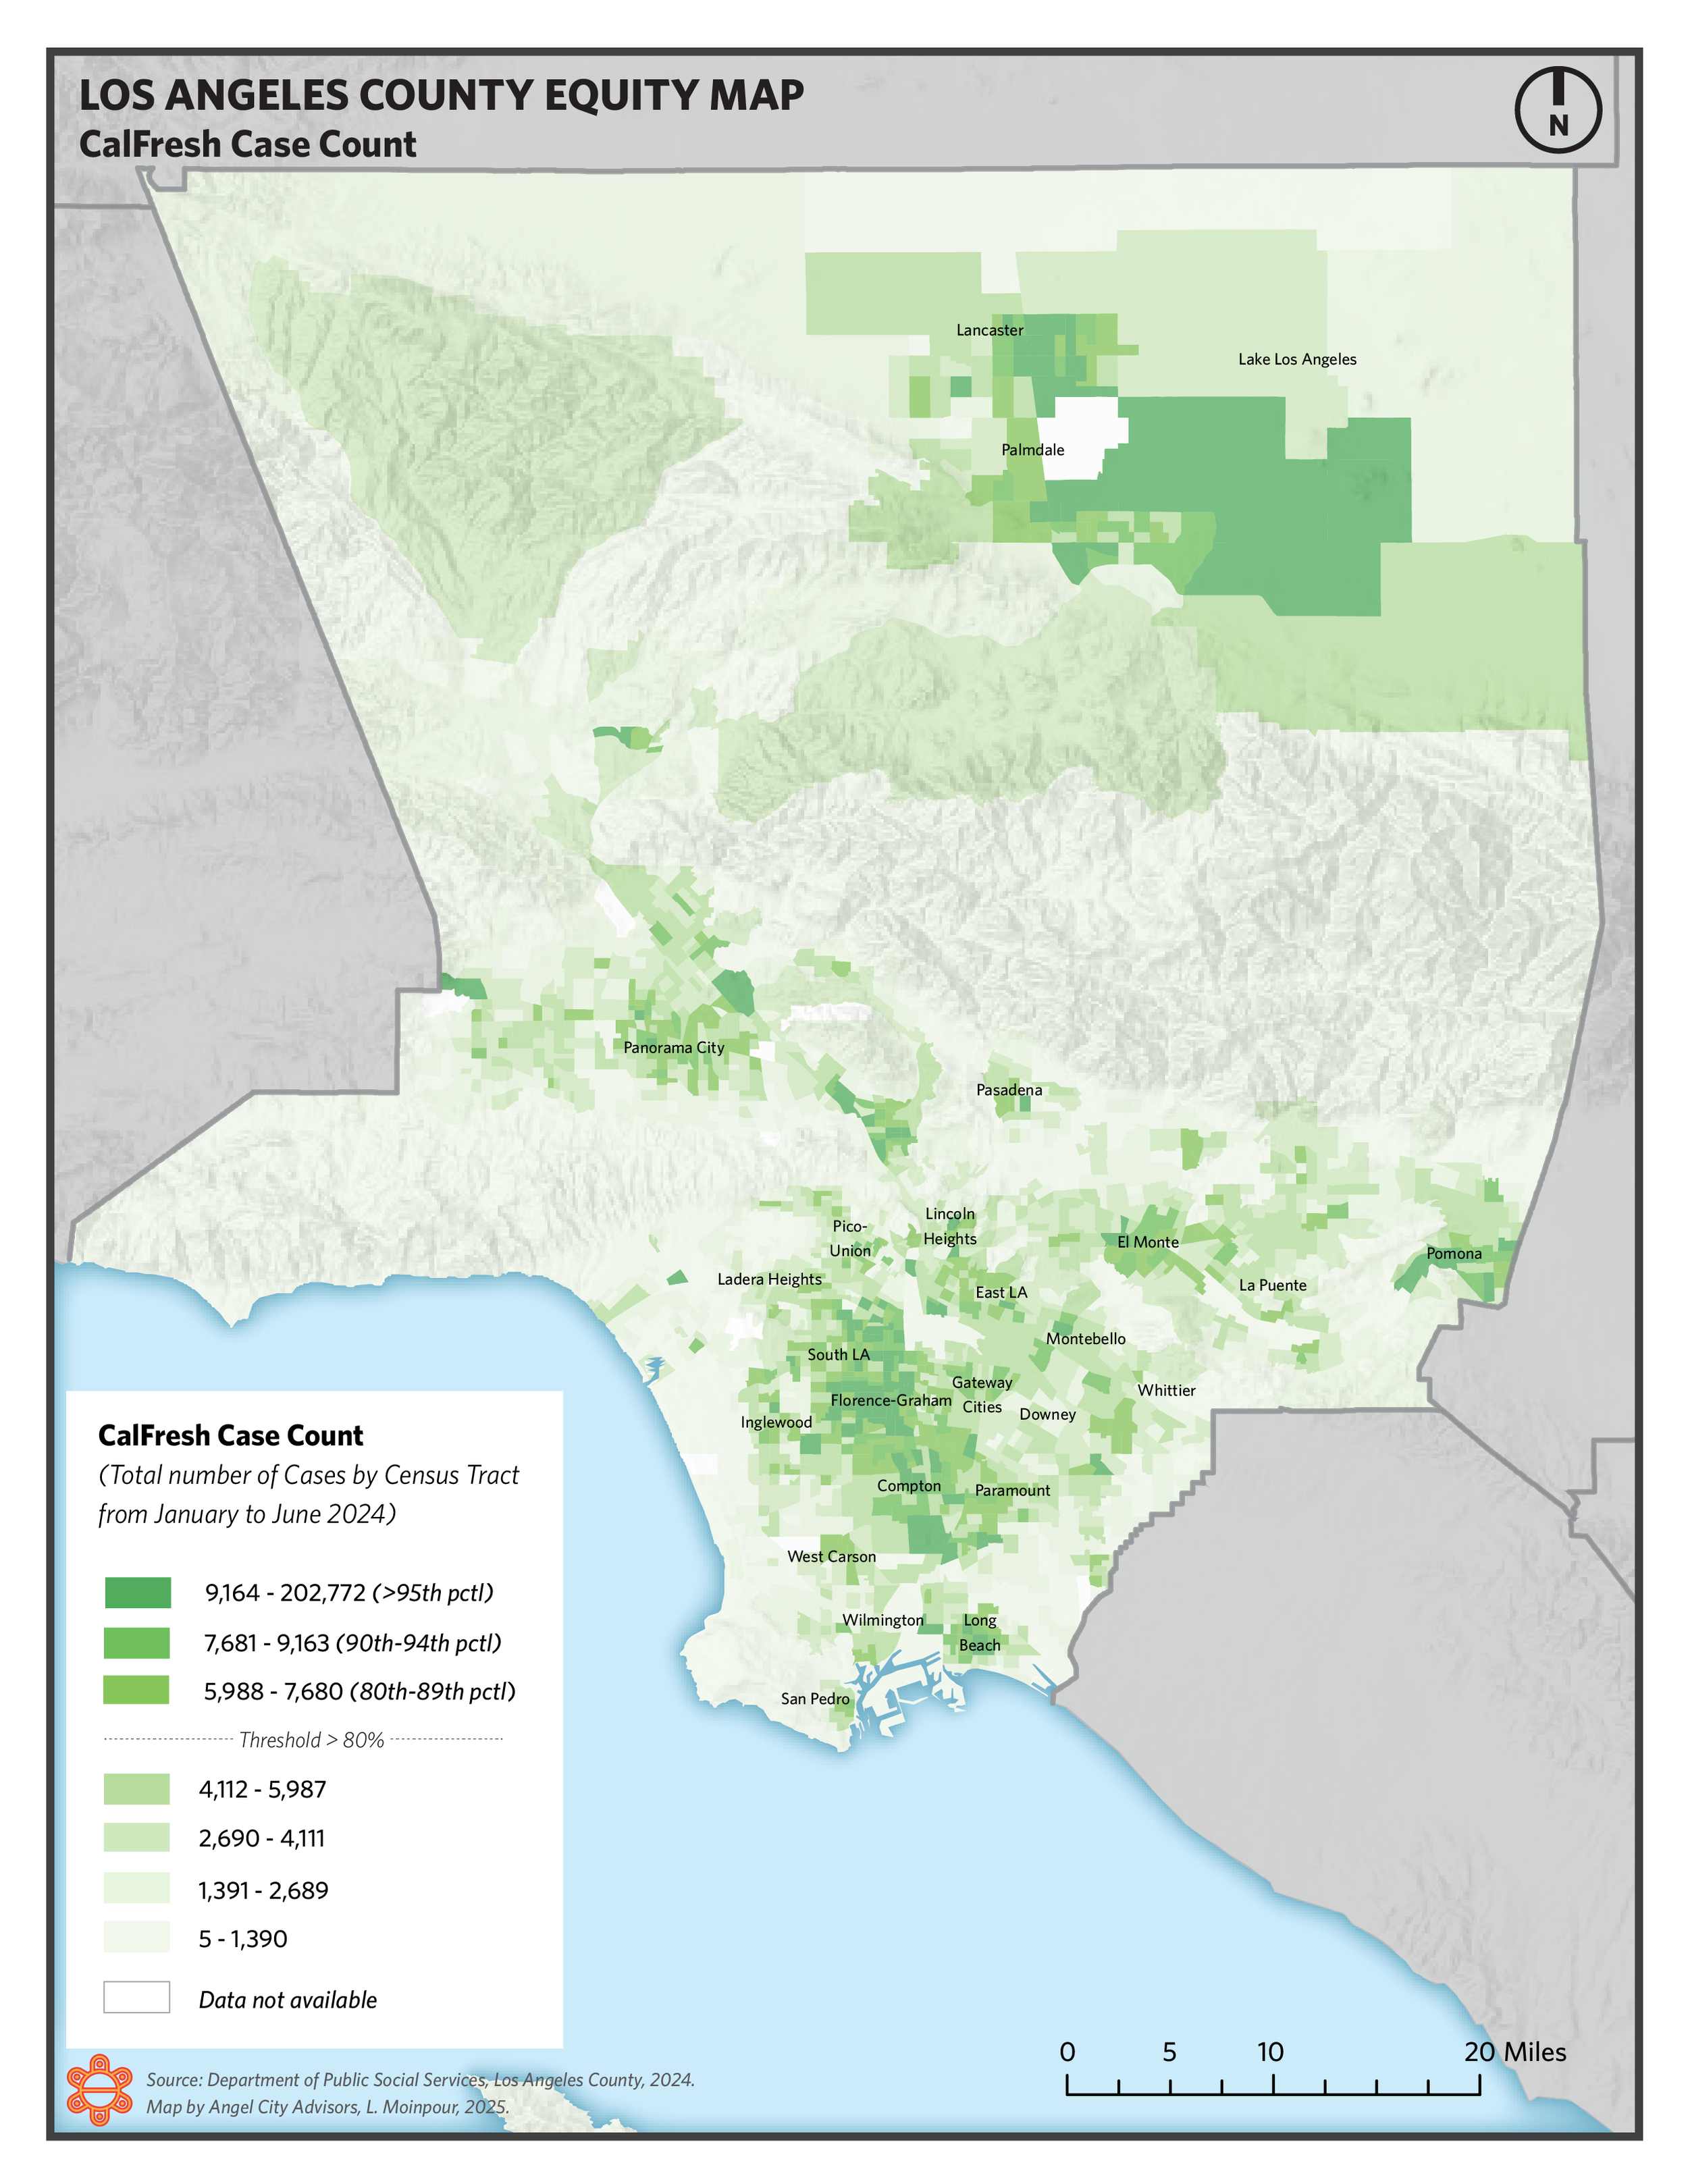
CalFresh: Case Count

CalFresh: Case Count, zoom-in
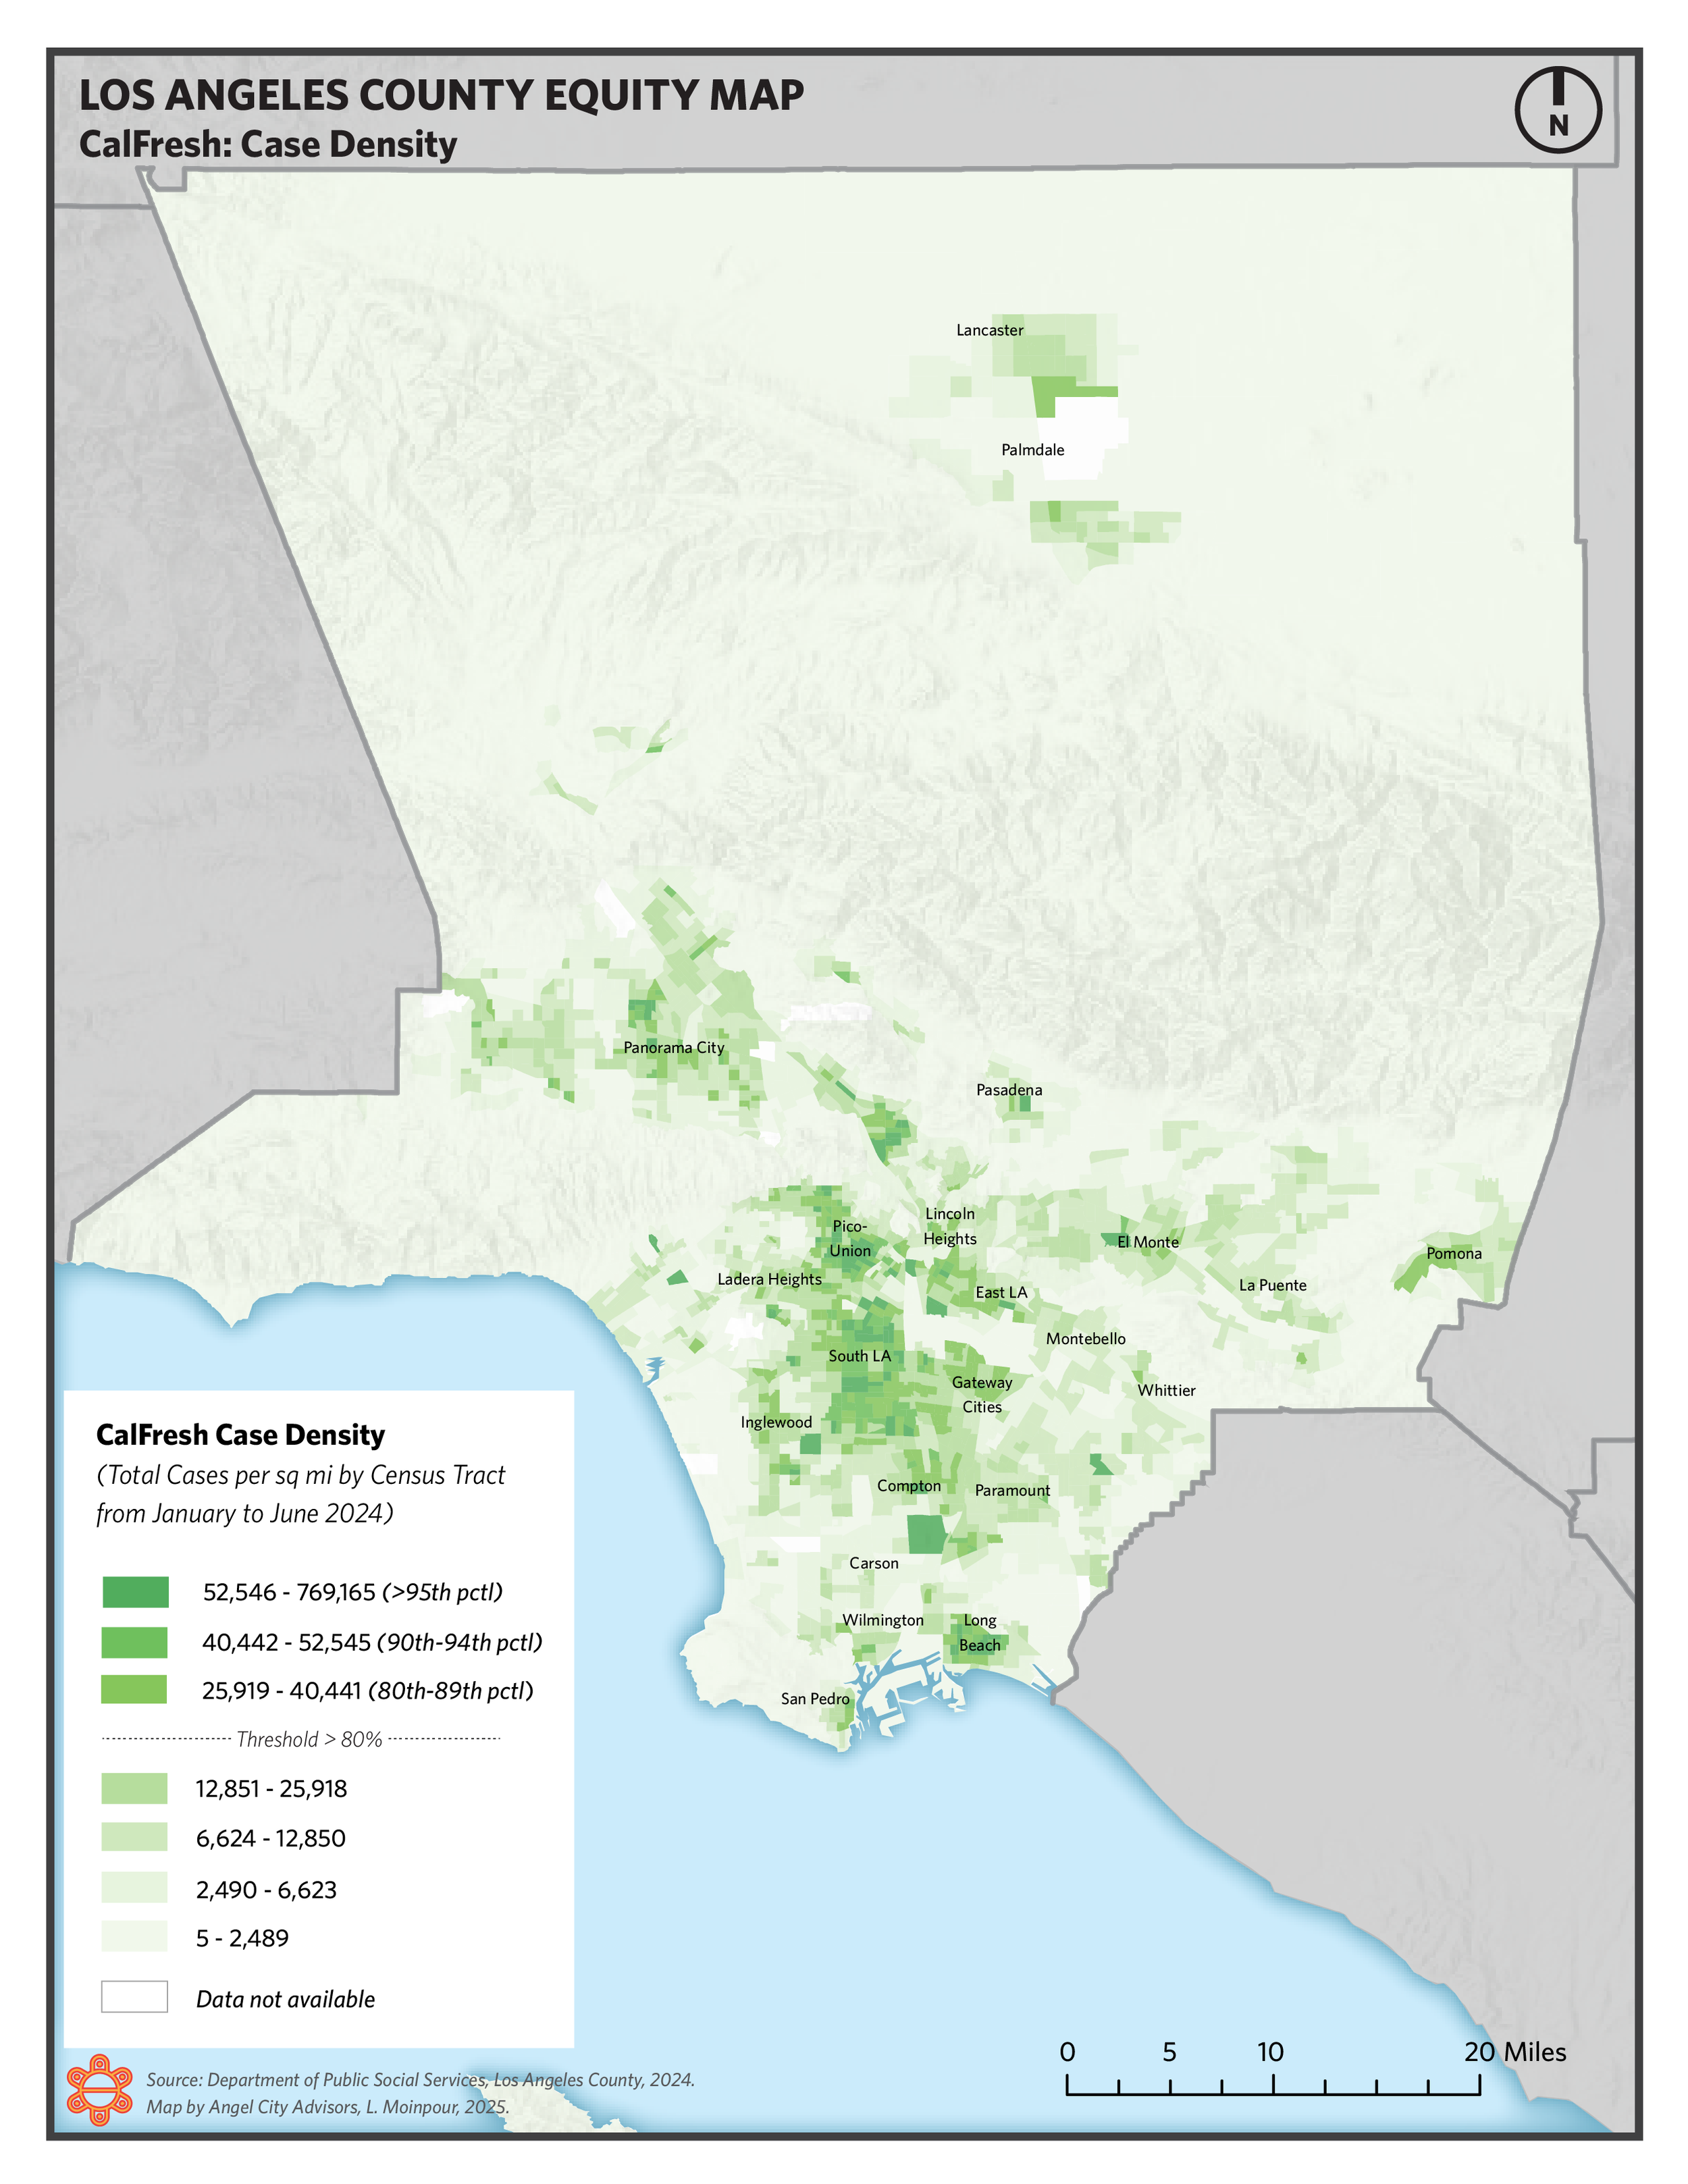
CalFresh: Case Density
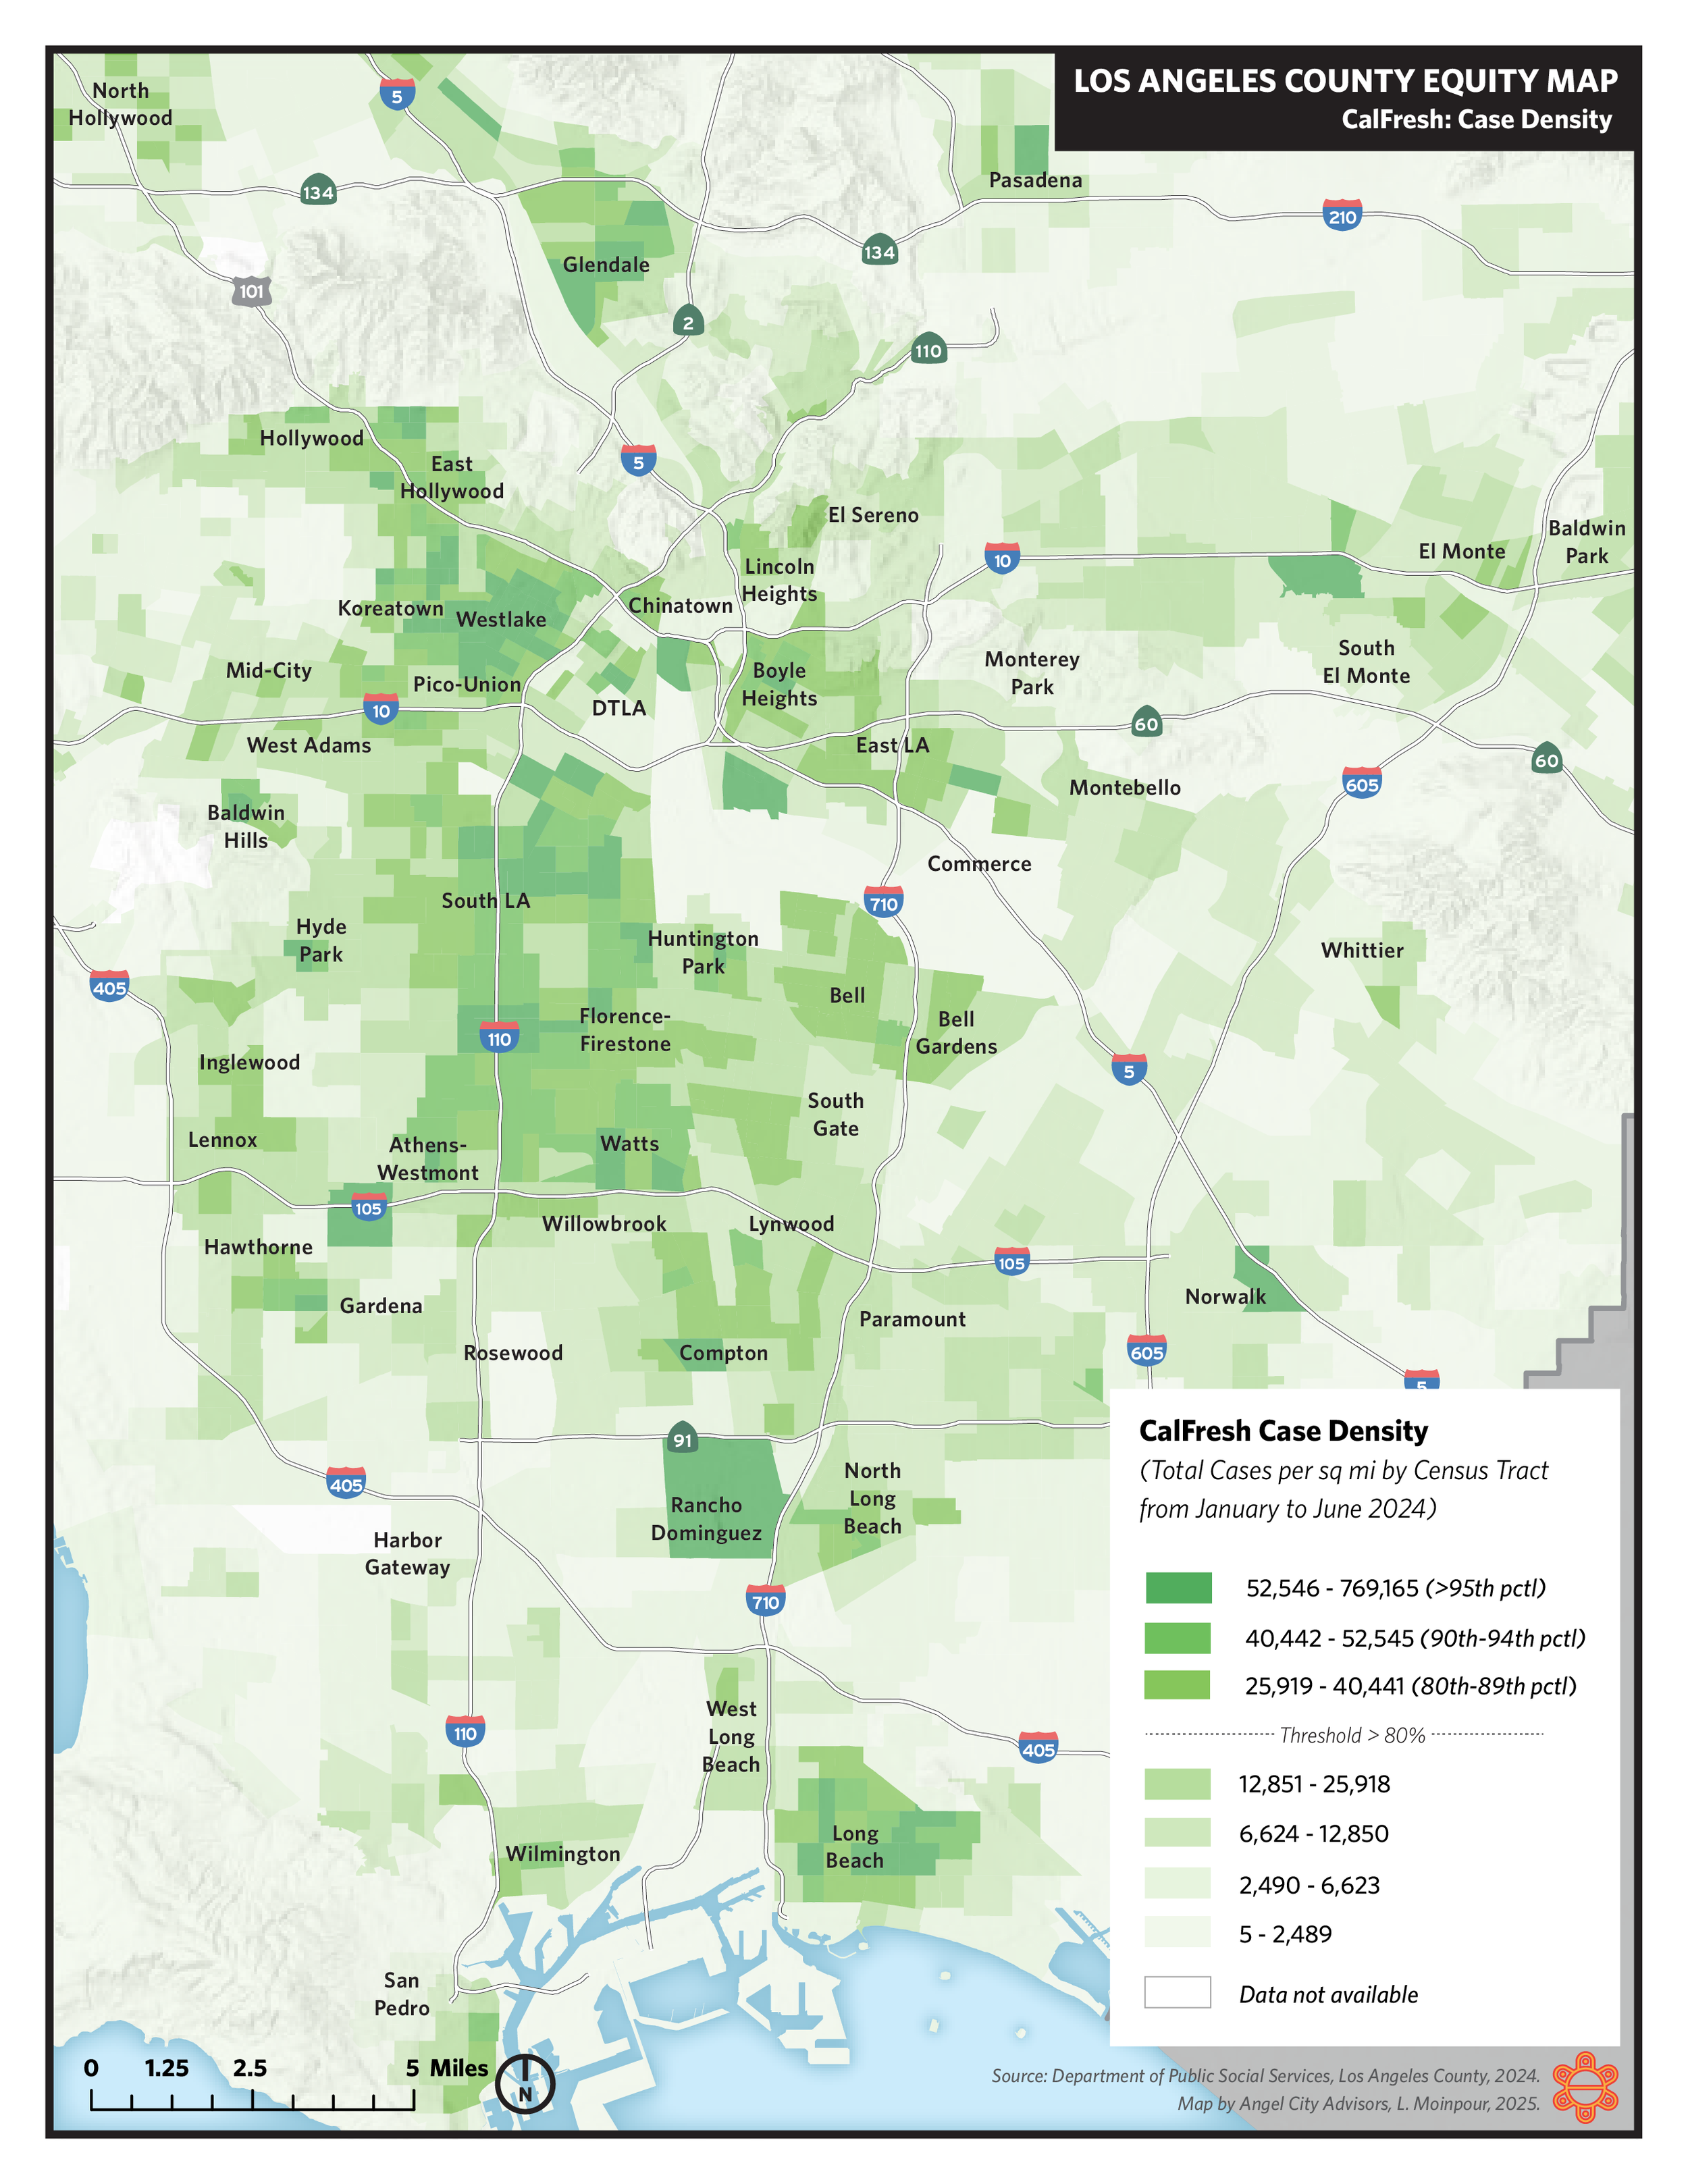
CalFresh: Case Density, zoom-in
Co-Investment Opportunities
This grouping of maps uses data to visualize co-investment opportunities such as CDGB allocations, NMTC-eligible zones, among others.
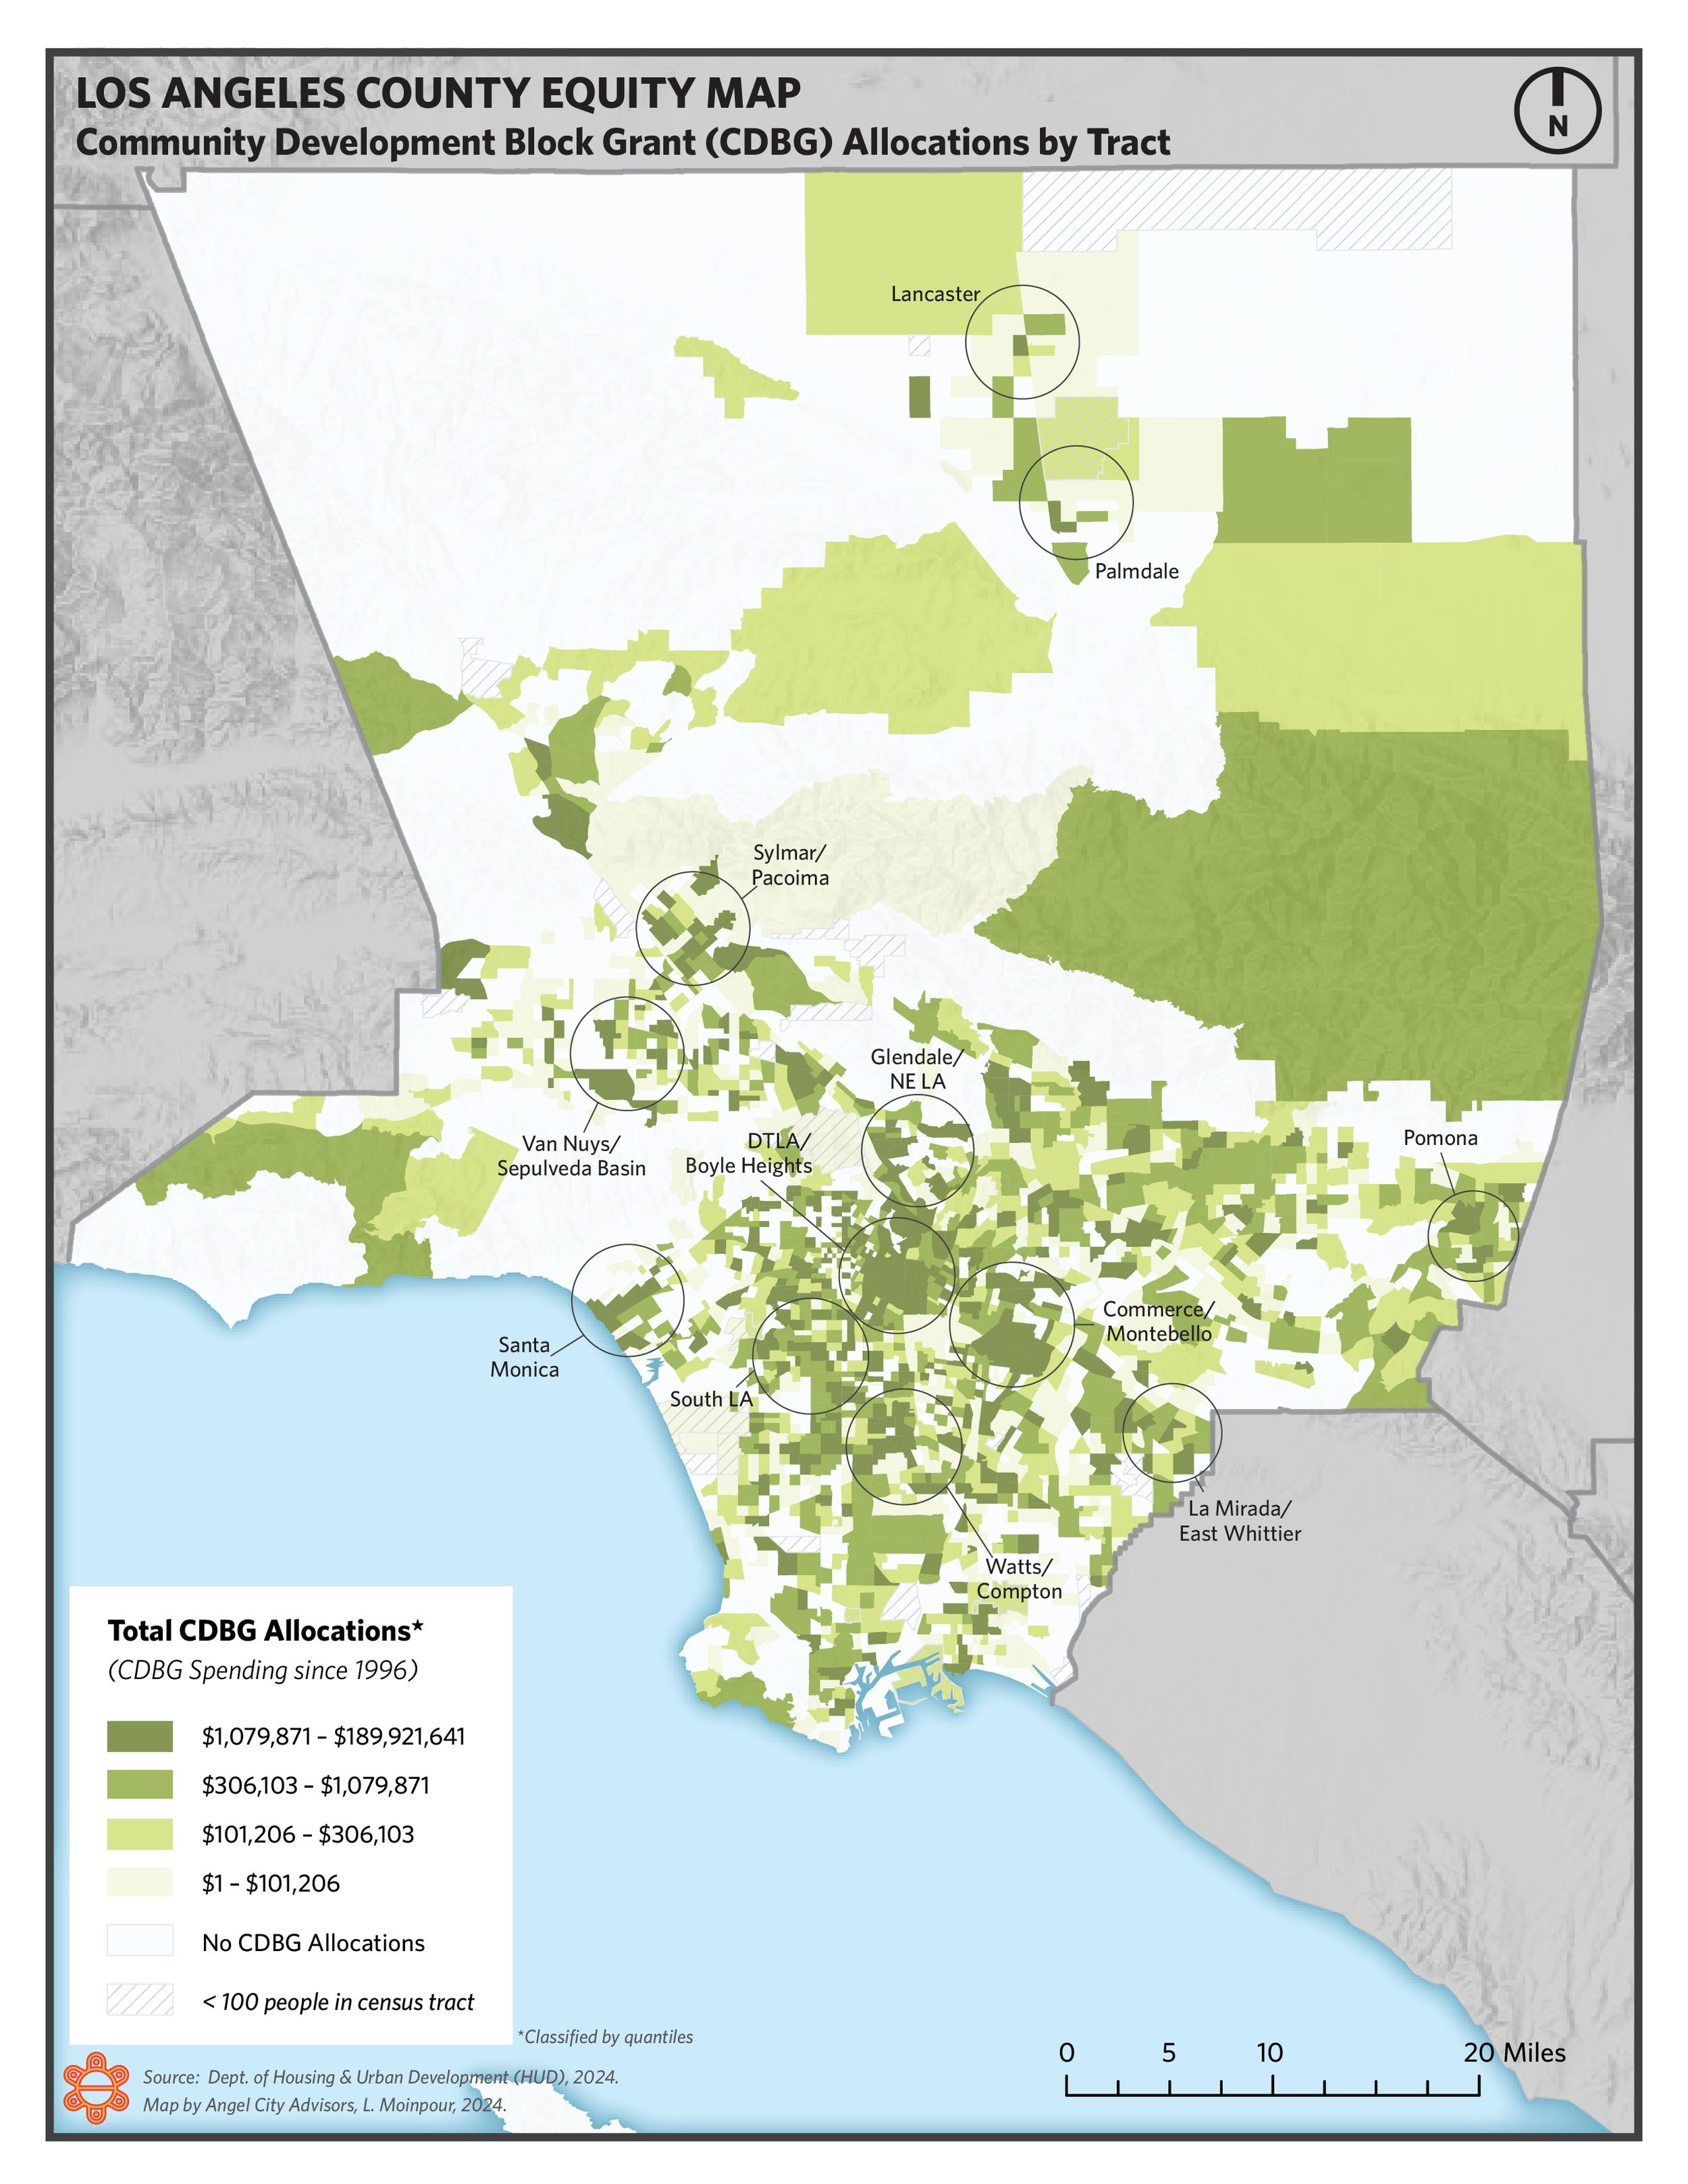
Community Development Block Grant (CDBG) Allocations

Community Development Block Grant (CDBG) Allocations, zoom-in

New Market Tax Credit (NMTC) Investments

New Market Tax Credit (NMTC) Investments, zoom-in
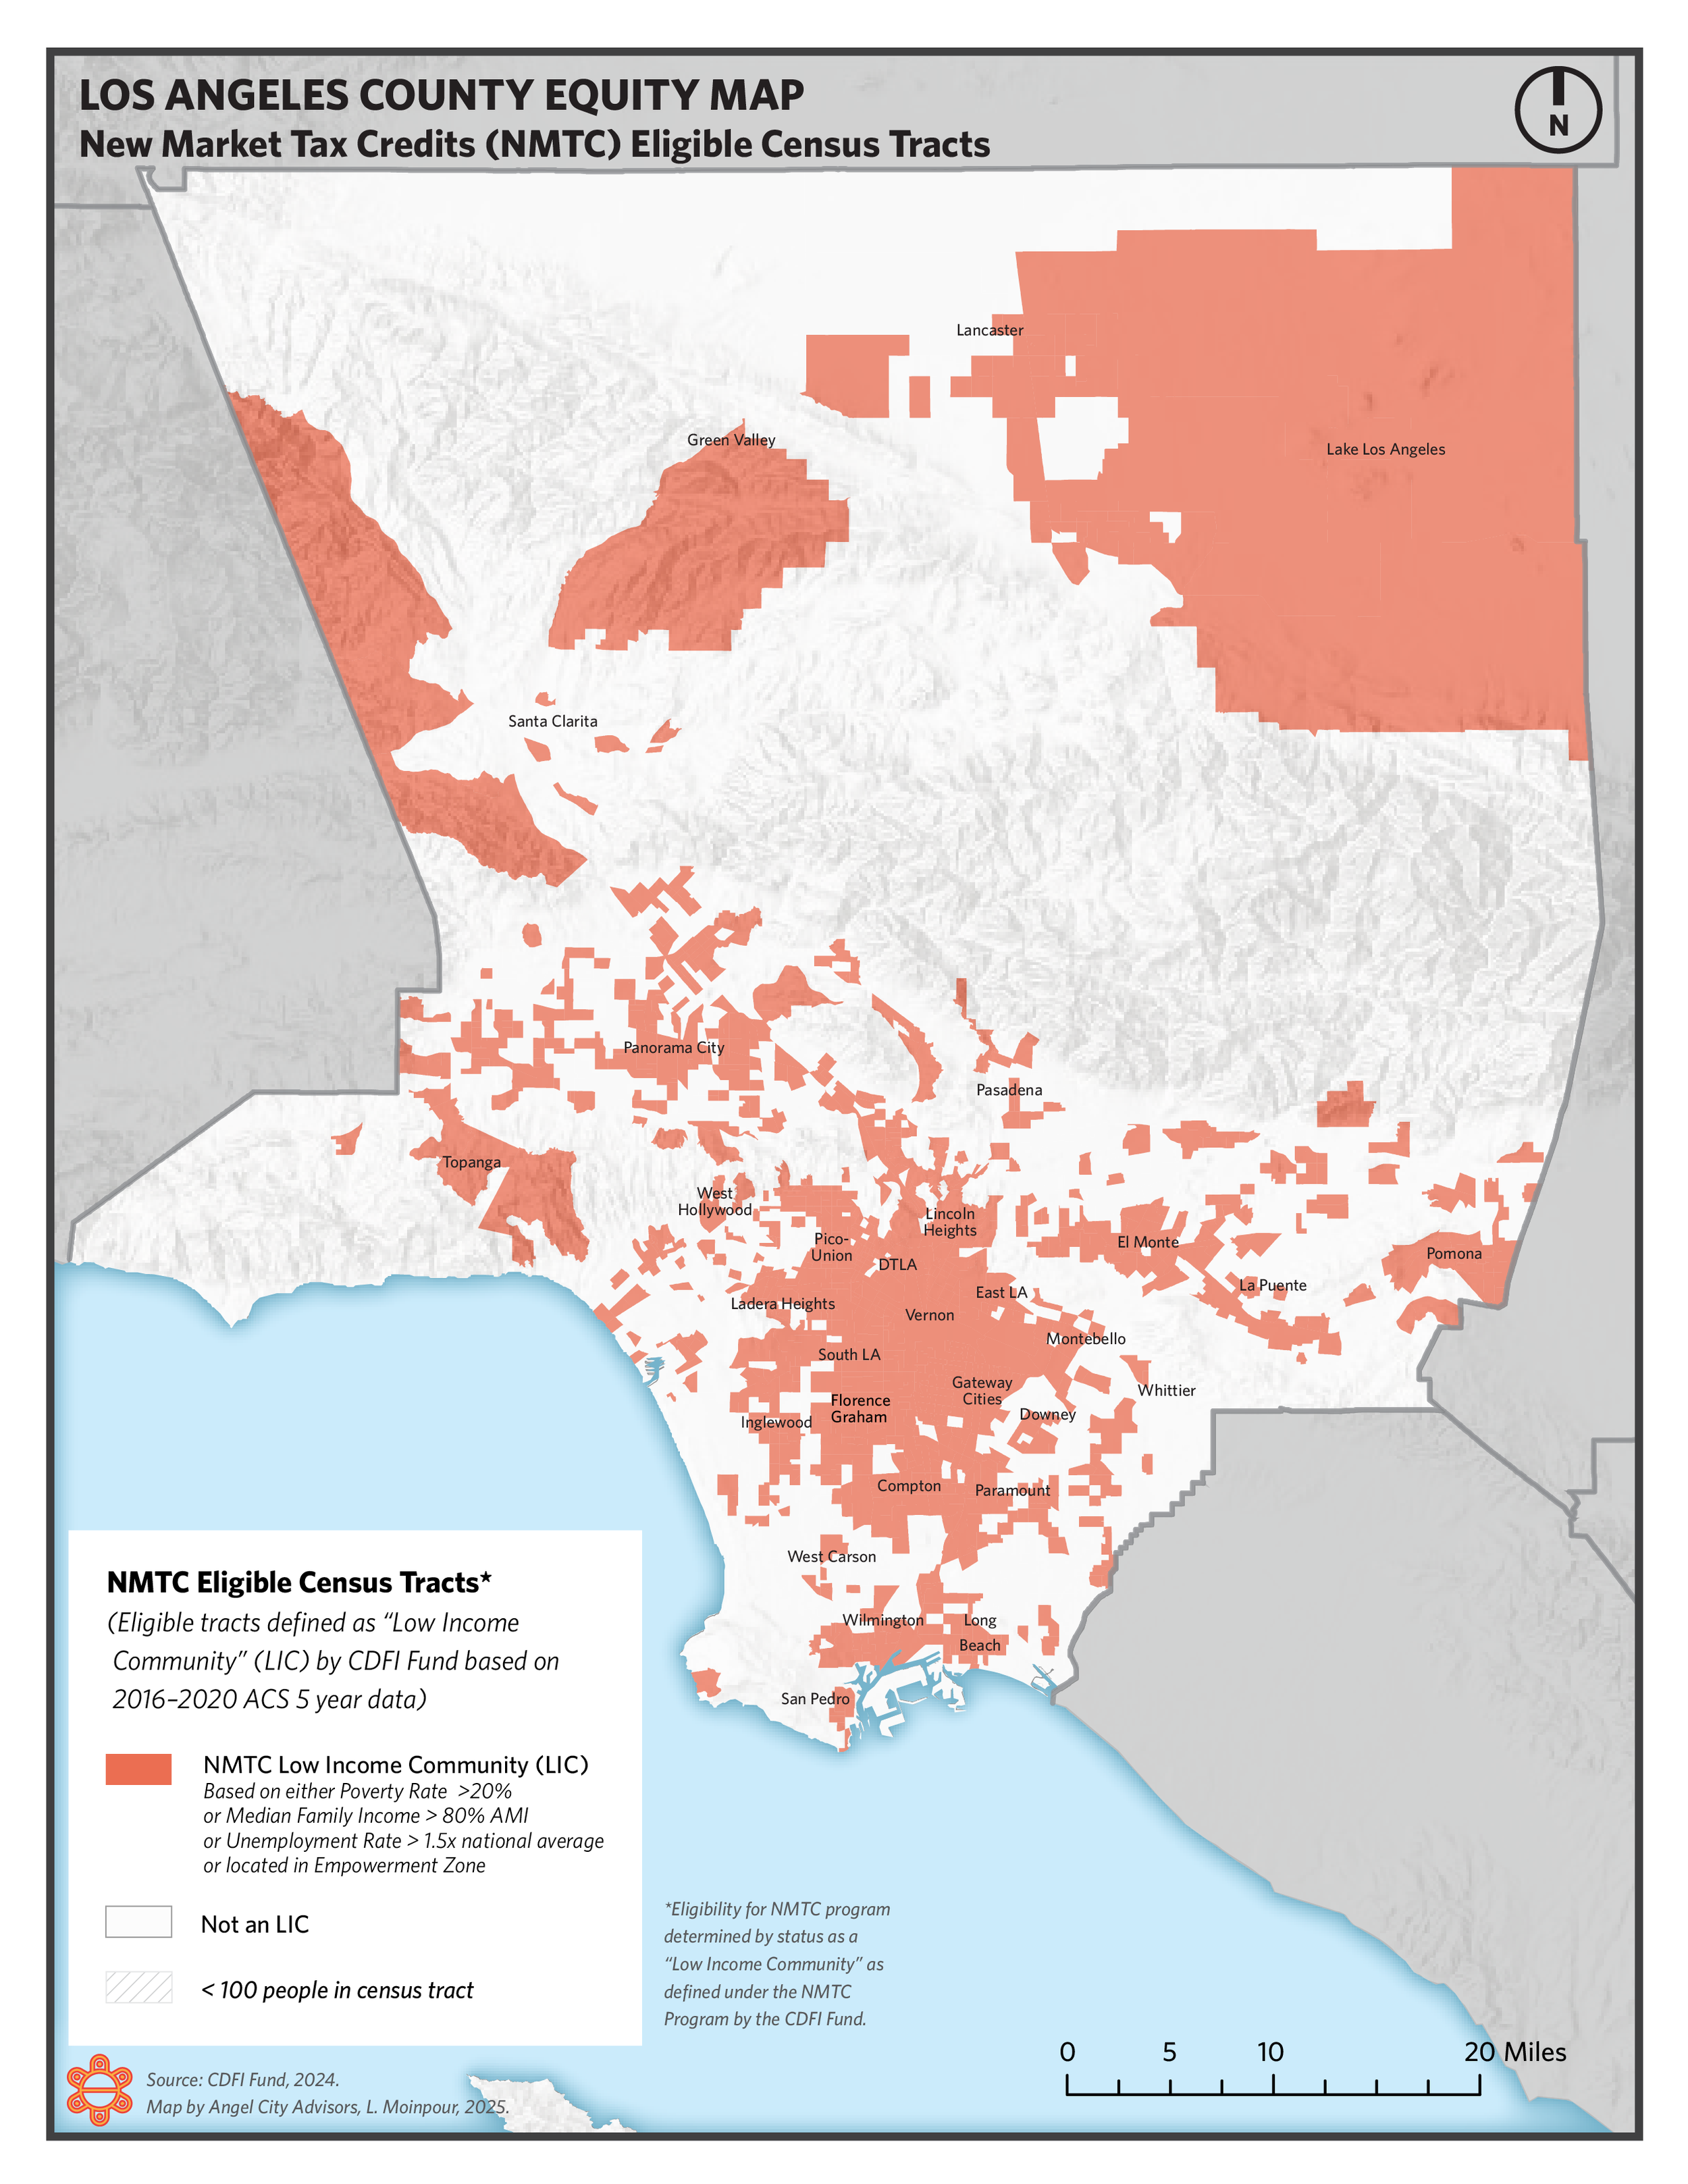
New Market Tax Credit (NMTC) Eligible Census Tracts

AB 1550 Low Income Communities
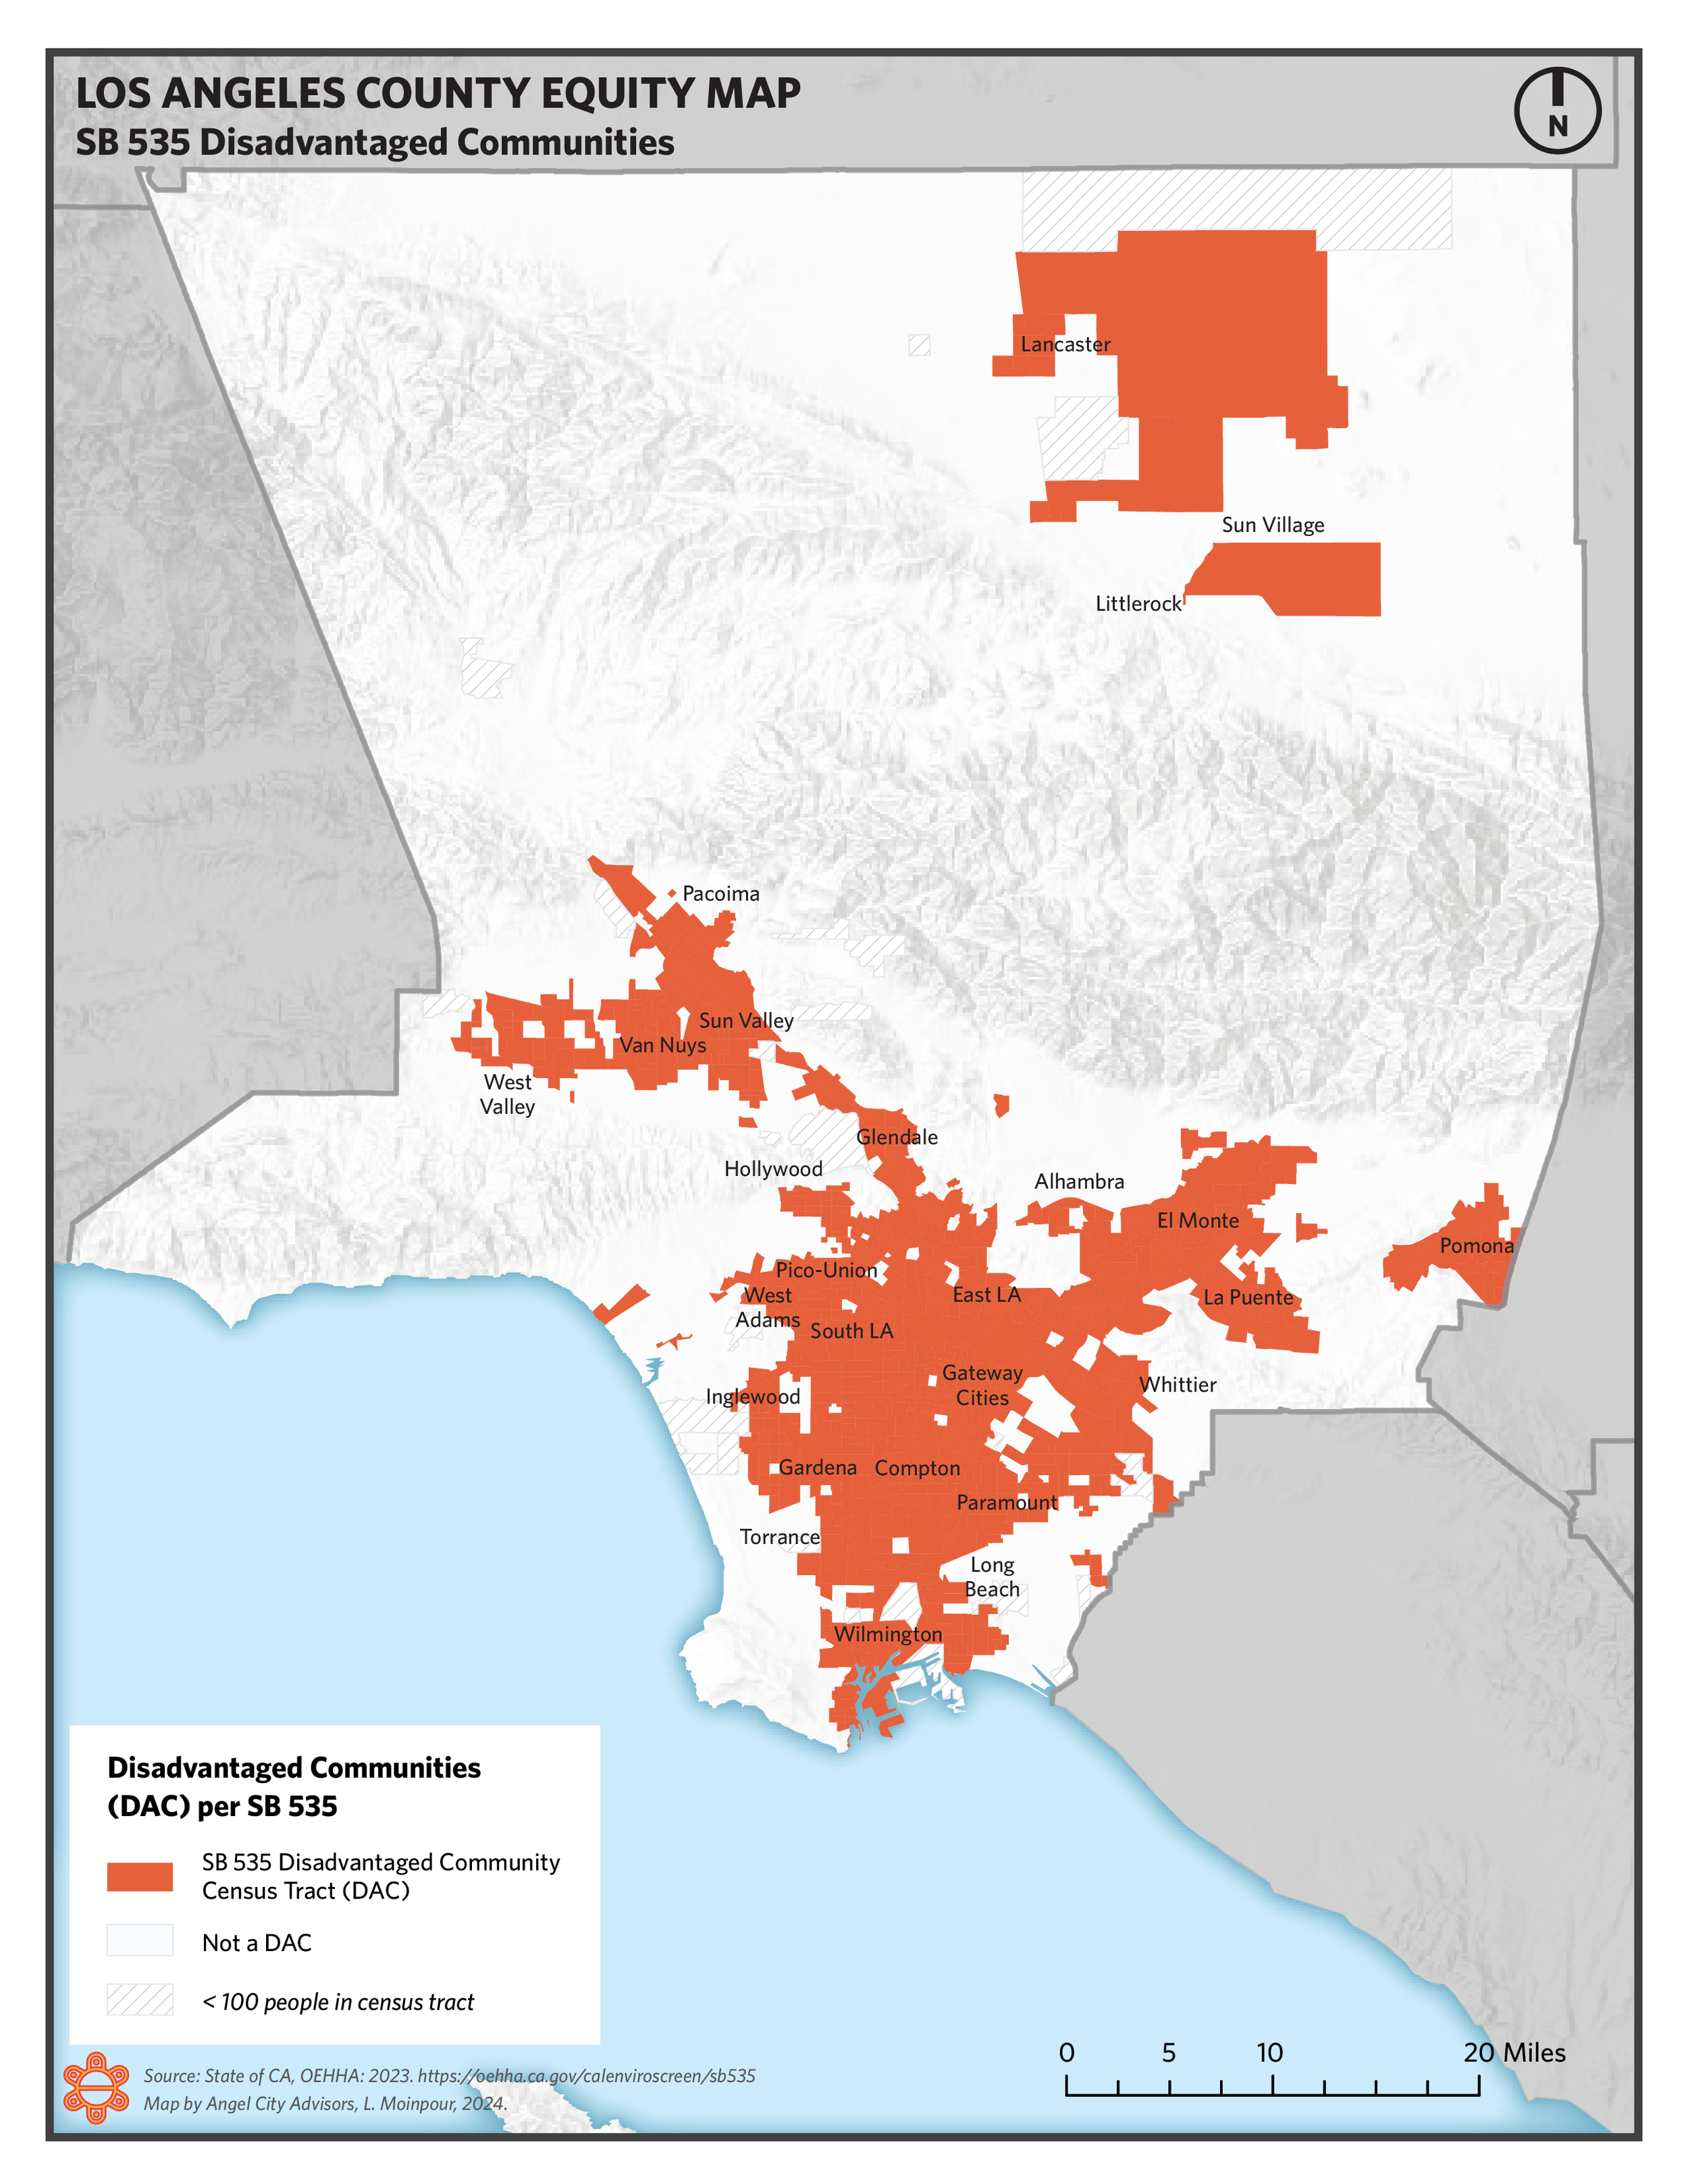
SB 535 Disadvantaged Communities